What Is Page Speed?
Page speed (also called “load speed”) measures how fast the content of a page loads. From an SEO standpoint, having a fast page speed is essential.
Many factors, such as your web hosting and your page size, affect page load speed. Page speed also differs on the desktop and mobile versions of a page.
In this article, you’ll discover how page speed affects SEO, find tools to measure it, and learn ways to improve it.
Why Is Page Speed Important for SEO?
Page load speed is a confirmed ranking factor on desktop and mobile.
In other words:
Faster loading times (along with other important signals) can contribute to higher rankings.
Page speed affects your search engine rankings because slow sites negatively affect user experience.
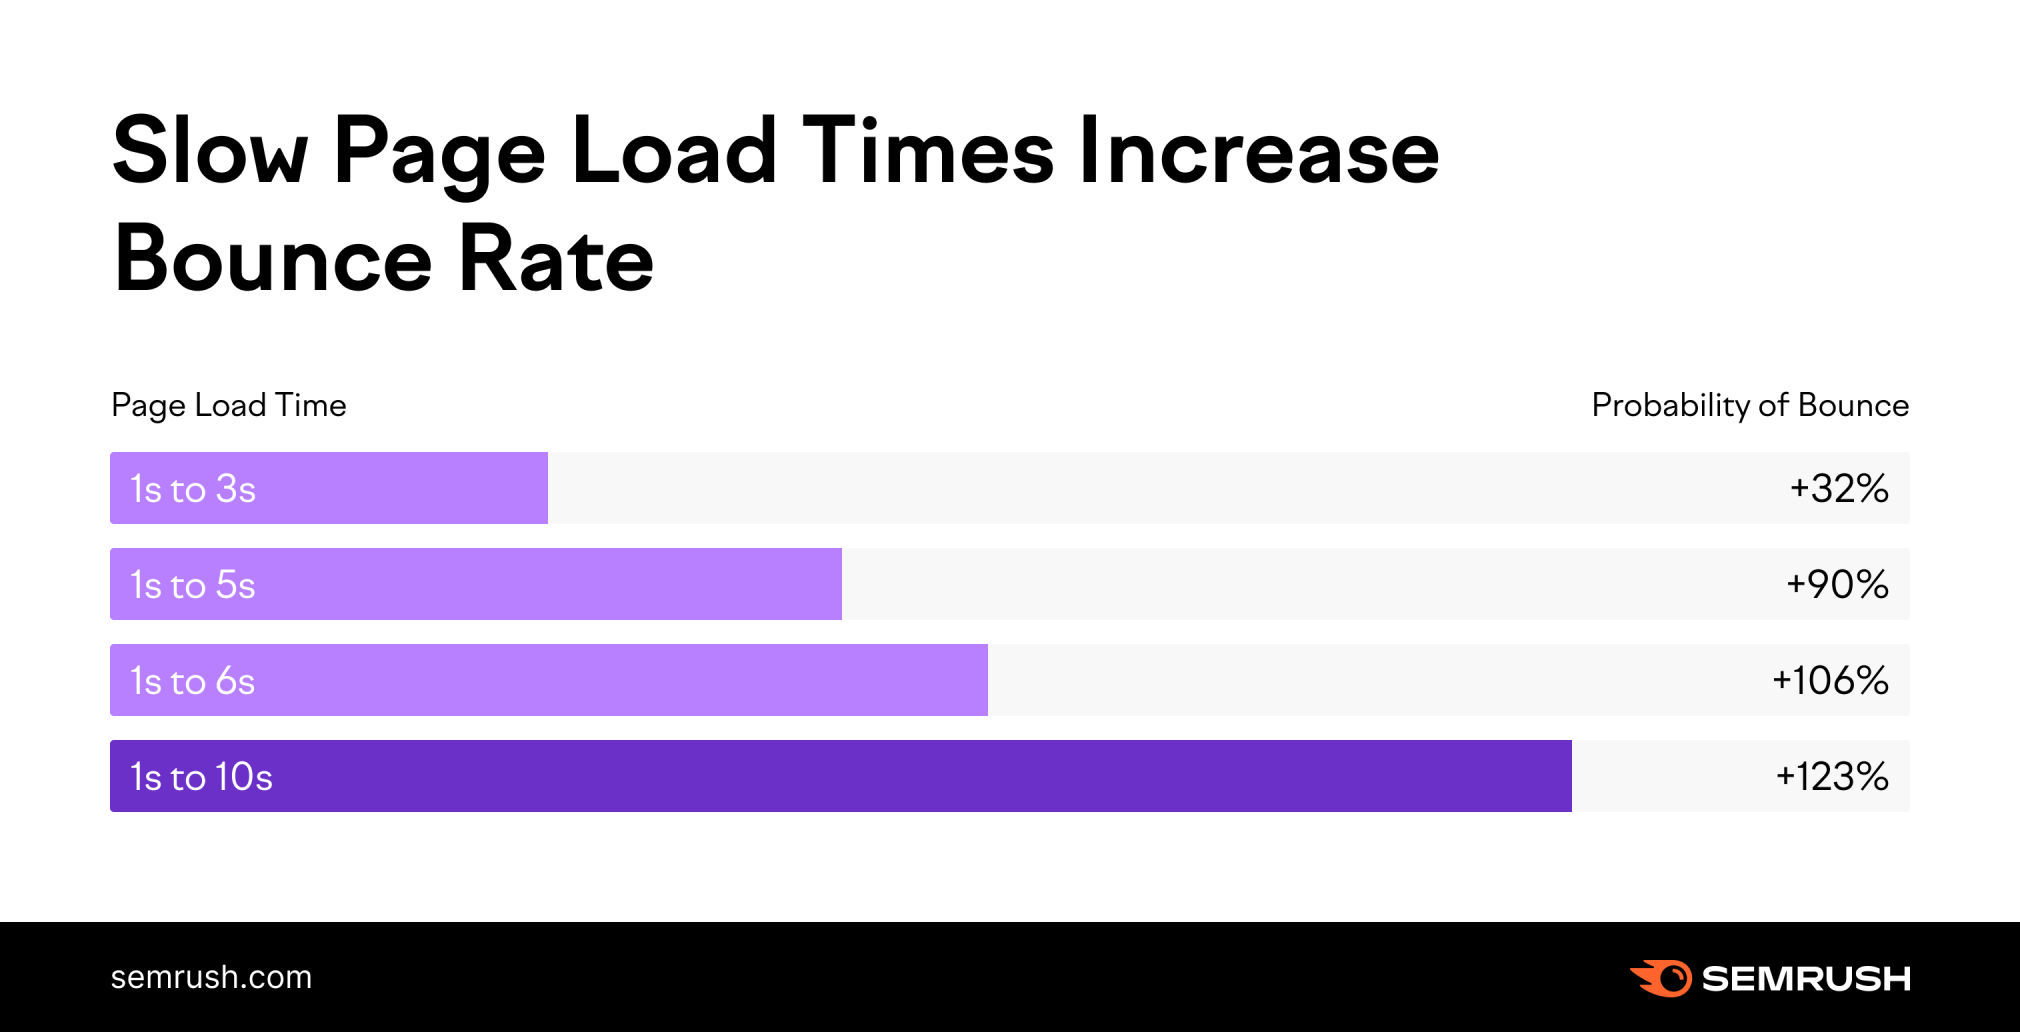
In fact, the probability of bounce almost triples if your page takes longer than three seconds to load, according to Google.
But it’s important to clarify:
“Page speed” is not a single metric. It acts as an umbrella term.
Why?
Because there are many ways to measure page speed. (Check out some tools that do so below.)
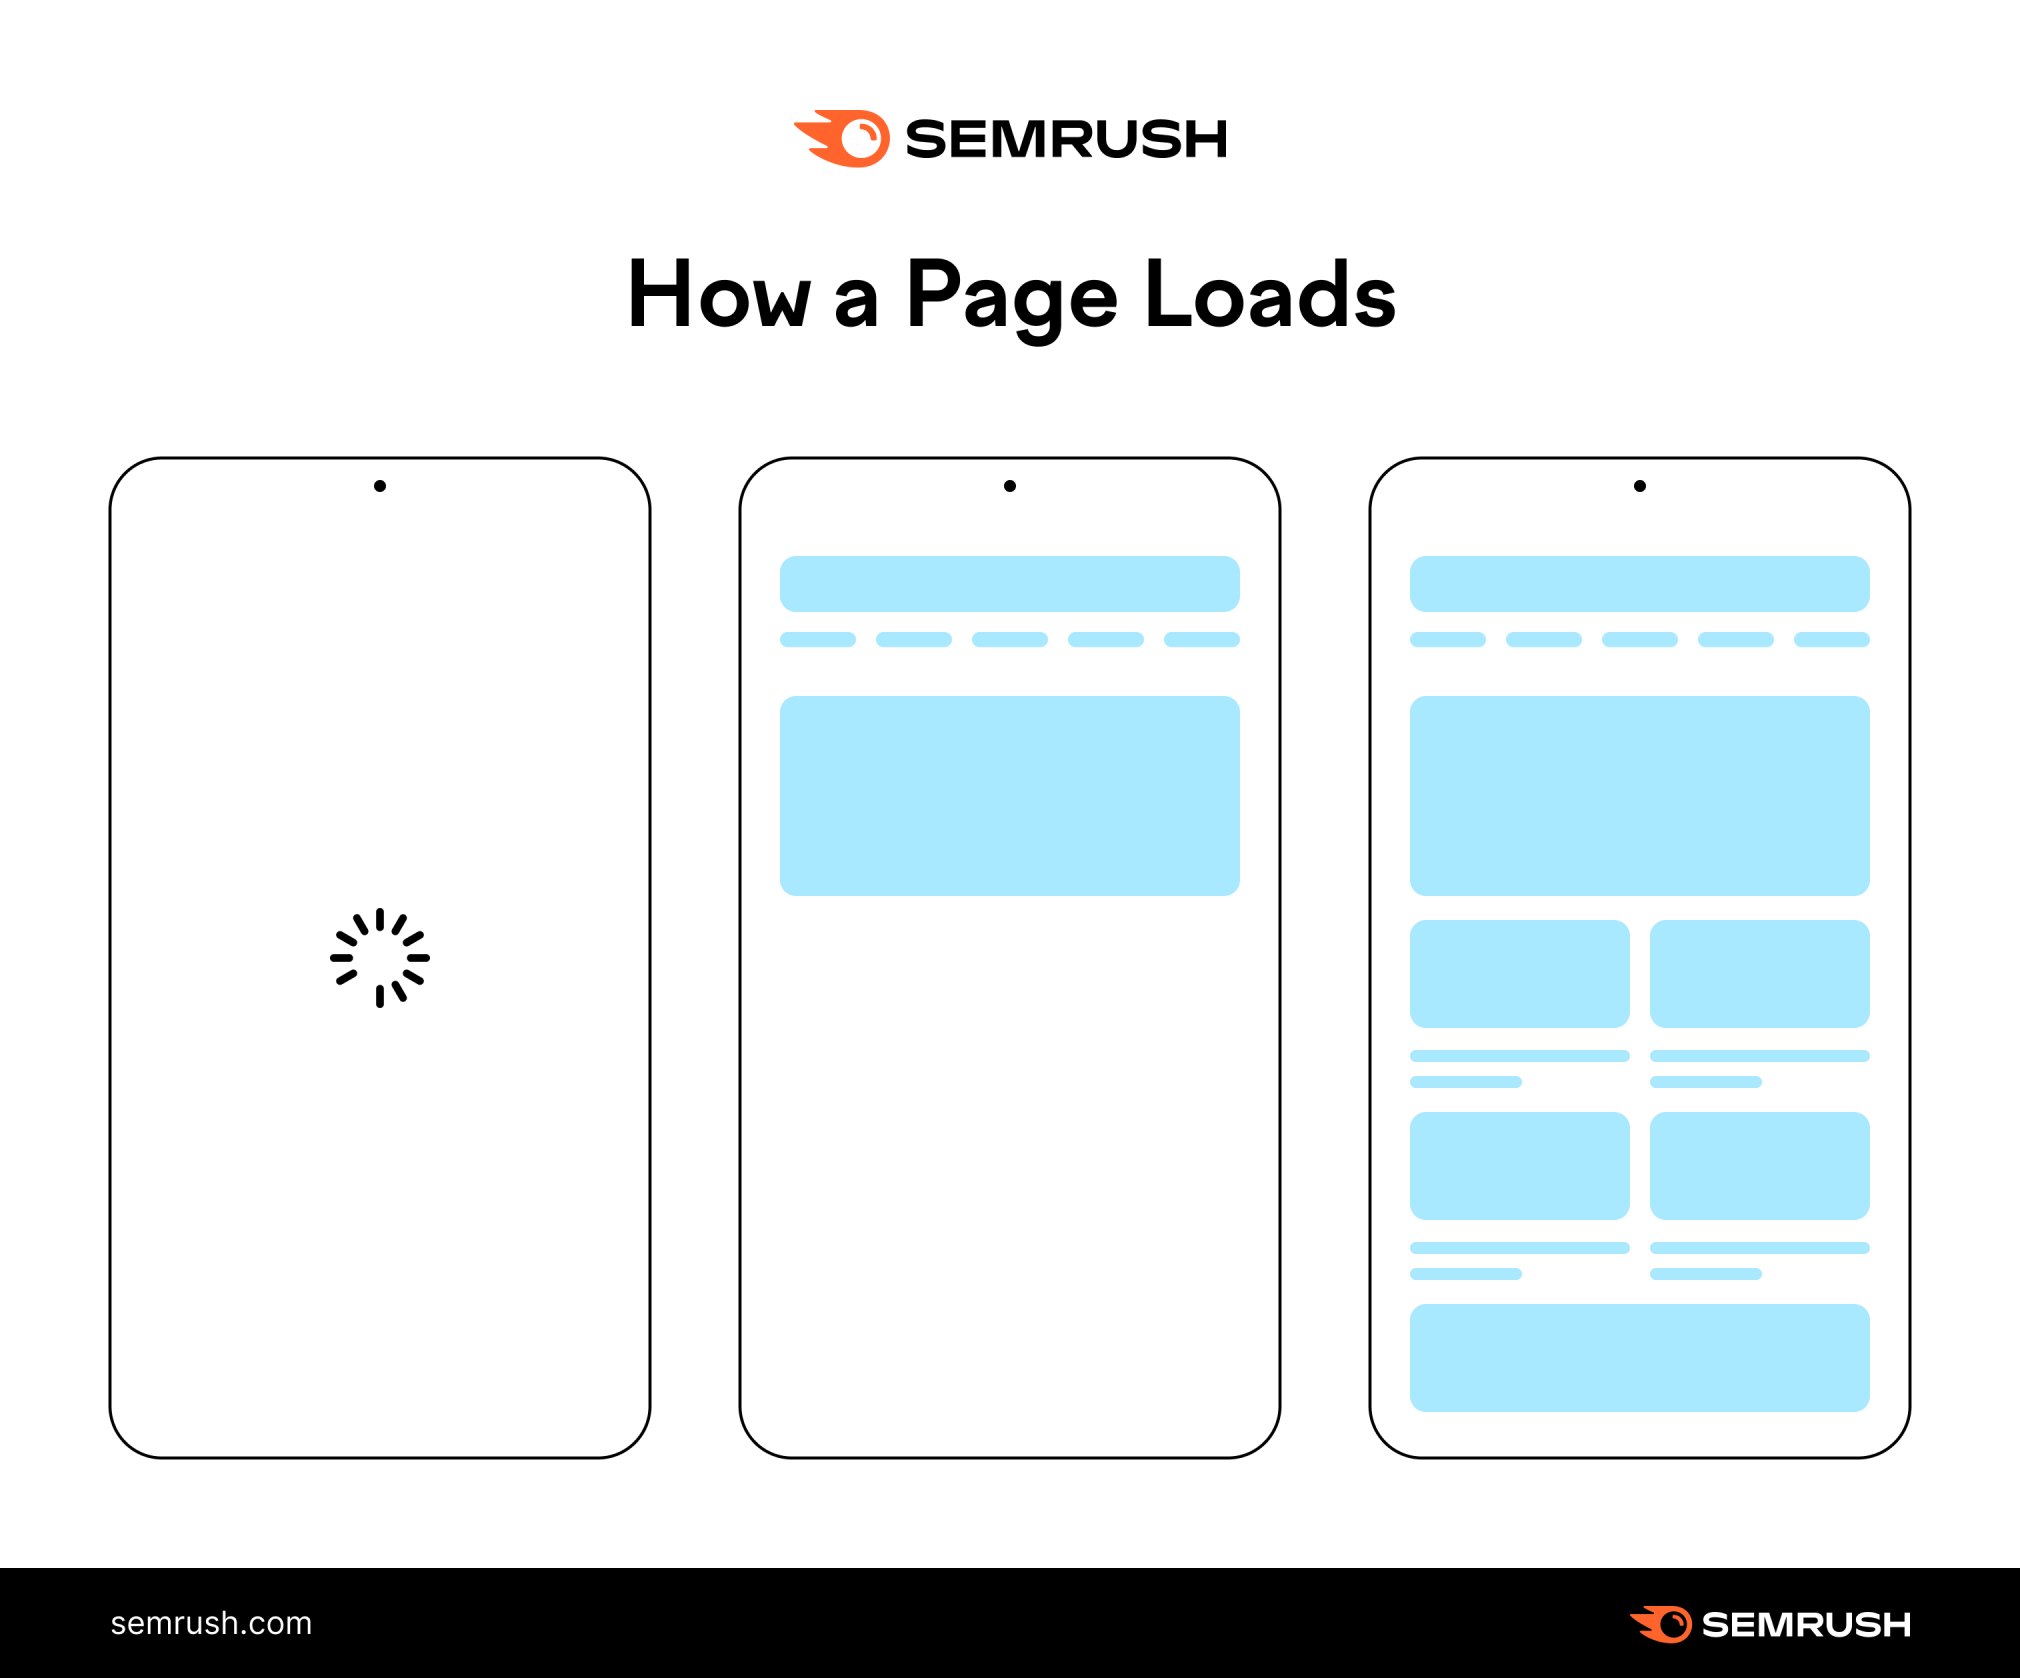
Say a user types a domain into their web browser and presses “enter.”
After a short time, the site opens.
Sometimes, the first thing the user sees is a blank page.
A few milliseconds (or seconds) later, users see some elements. Maybe a block of text or an image.
At a certain point, the user can interact with the page. They can click a button, for example.
While users wait, the content on the page might move around as new elements load.
And, eventually, the content of the page fully loads.
Sometimes, by the time the page loads completely, users have already found what they were looking for.
Other times, they have given up and left the page.
As you can see, a lot happens when you’re loading a site. And everything happens at a different pace.
You can measure each of these events separately. That’s why we say page speed is not a single metric, but many.
Common page speed metrics include the following:
- Time to First Byte (TTFB): How long it takes for the page to begin loading
- First Contentful Paint (FCP): How long it takes for the user to see the first element of a page (like an image)
- Onload time: How long it takes to fully load the content of a page
Next, we’ll provide guidance on what a good page speed is based on Google’s Core Web Vitals.
How Core Web Vitals Affect Page Speed
Google’s Core Web Vitals are a set of metrics that score the user experience of a page. Google uses these three metrics to get a picture of loading speed based on actual speed, webpage interactivity, and visual stability:
- Largest Contentful Paint (LCP) measures how long it takes for your main content to load. It should be 2.5 seconds or less.
- First Input Delay (FID) measures how long it takes until a user can interact with a page. It should be of 100 milliseconds or less.
- Cumulative Layout Shift (CLS) measures how often users experience layout shifts. Your CLS score should be 0.1 or less.
You need to understand Core Web Vitals to optimize page speed.
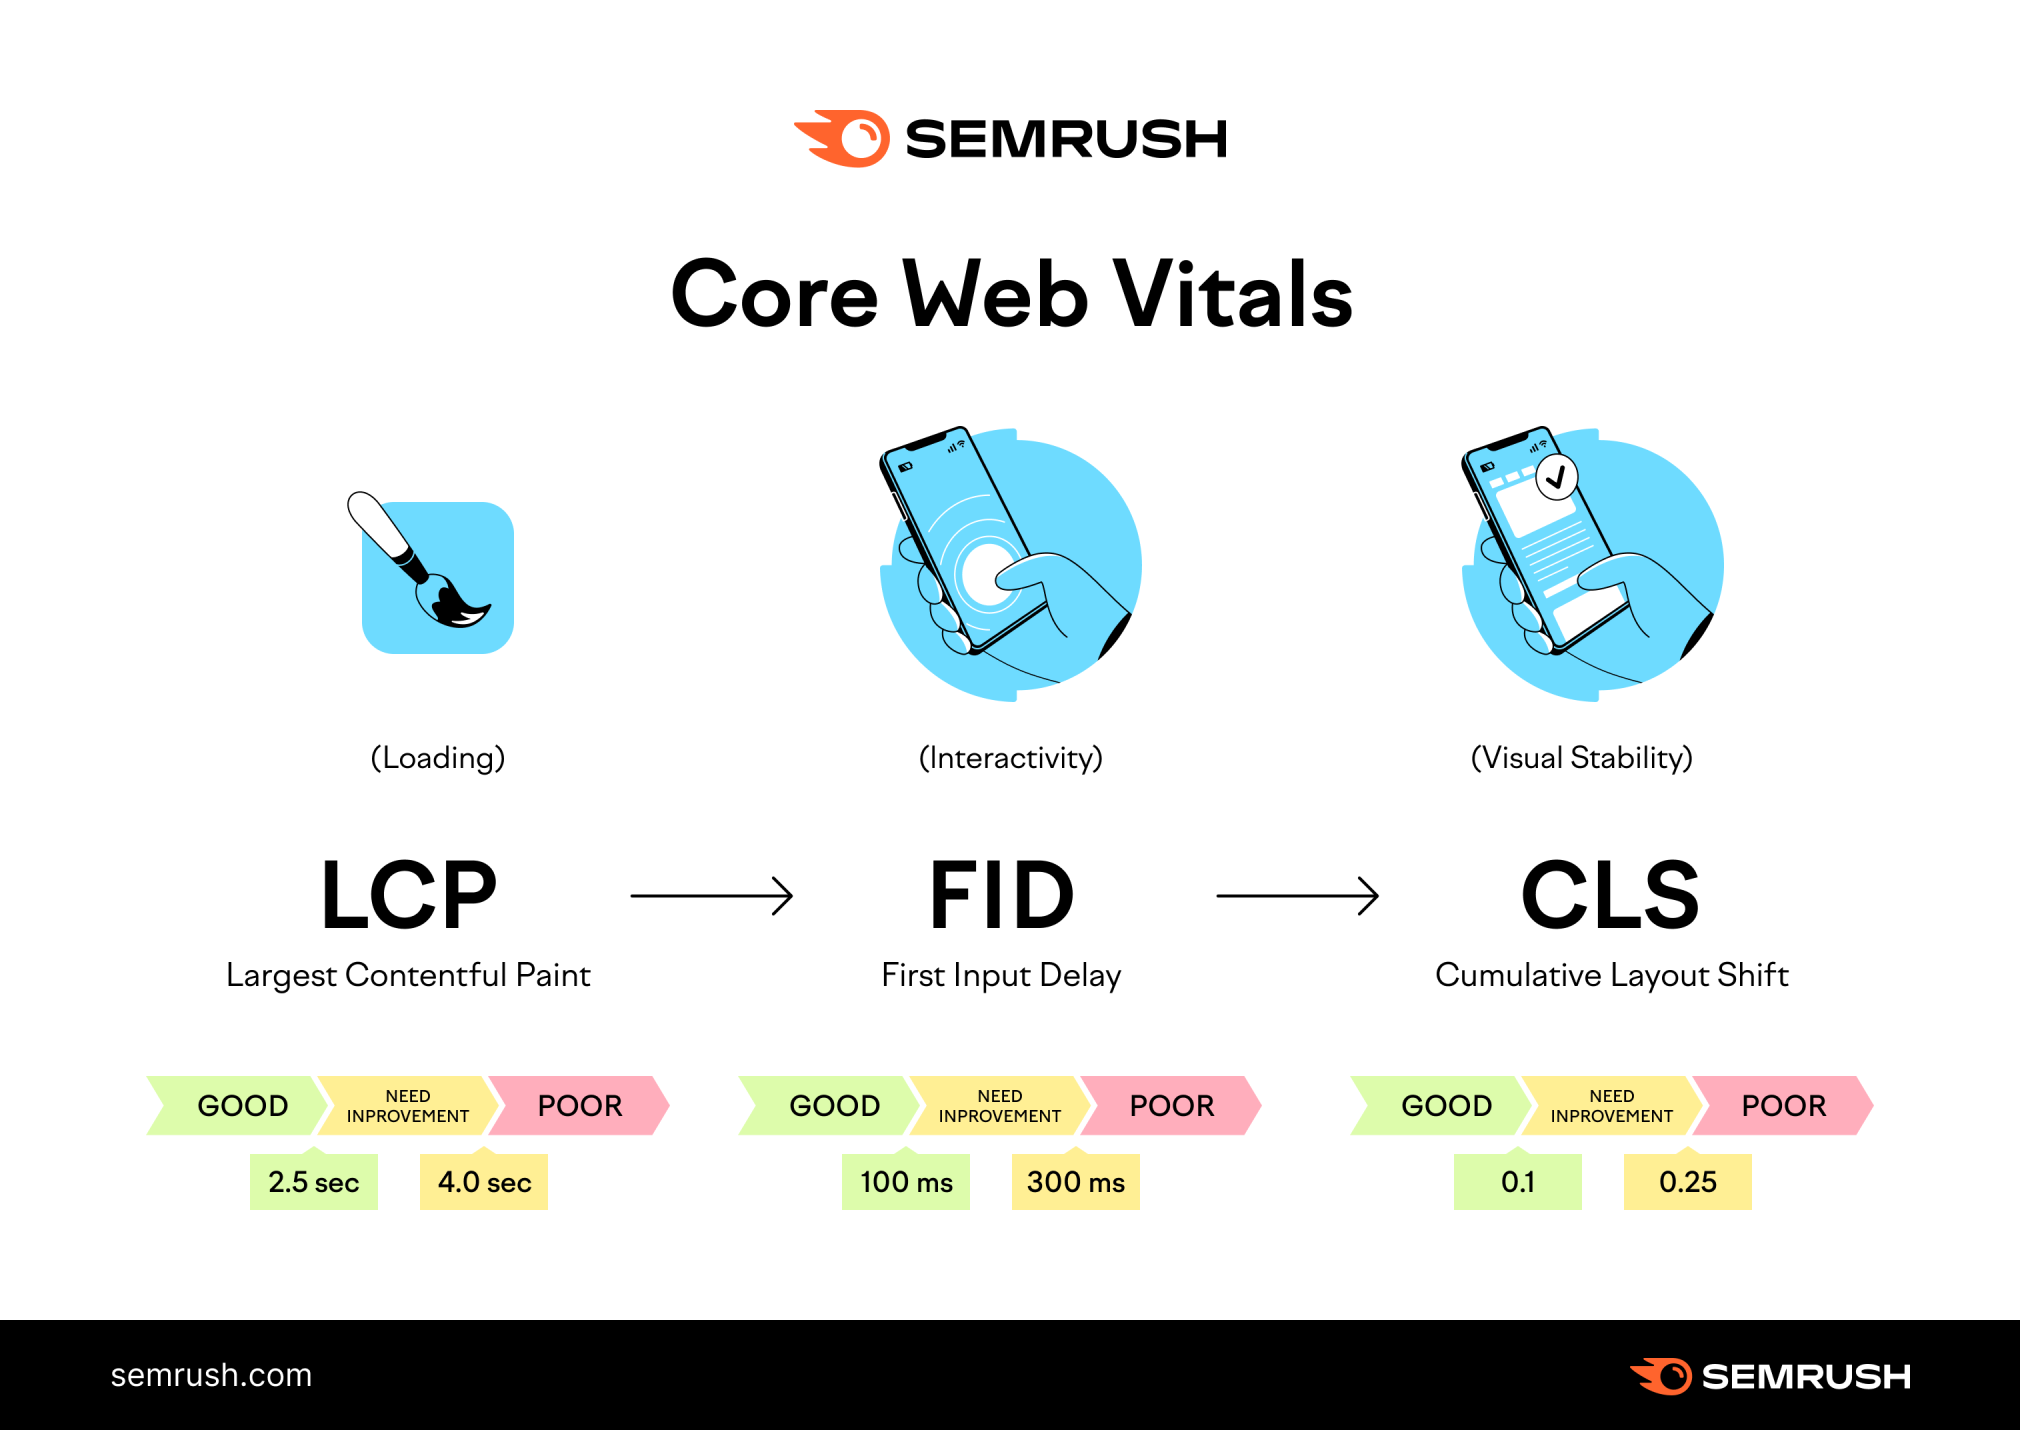
You can use these metrics to gauge how fast your page should be. Google classifies your site’s Core Web Vitals as “Good,” “Needs Improvement,” or “Poor.”
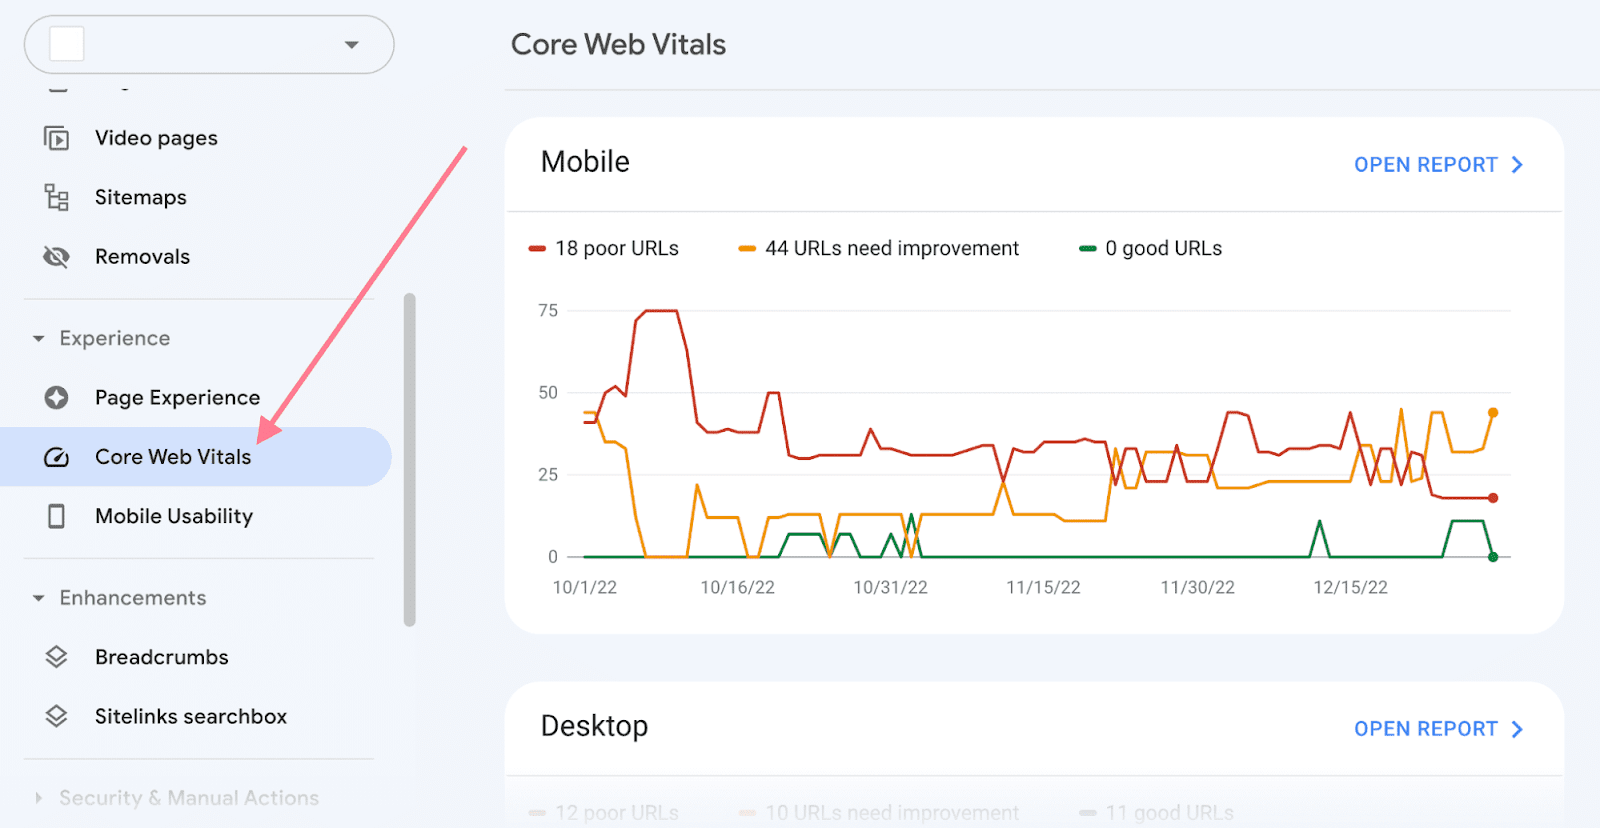
You can check your scores in the Core Web Vitals report in Google Search Console.
Note: Google says its page speed updates only negatively affect pages that deliver “the slowest experience.” But they recommend aiming for the "Good" threshold for best results. Once you hit that threshold, you won't necessarily see huge gains by micro-optimizing your page speed by a few milliseconds.
To summarize:
Optimizing pages with poor performance should be your priority. Because Google can penalize your site if you don’t.
And above all:
Don’t put page speed before good content. Because relevance will always come first.
A page that loads a “tiny bit faster” won’t necessarily outrank other slower pages. Because relevance and search intent are more important.
So you should first prioritize creating content that meets users’ needs.
With that said, these are Google’s thresholds to evaluate the Core Web Vitals of a page:
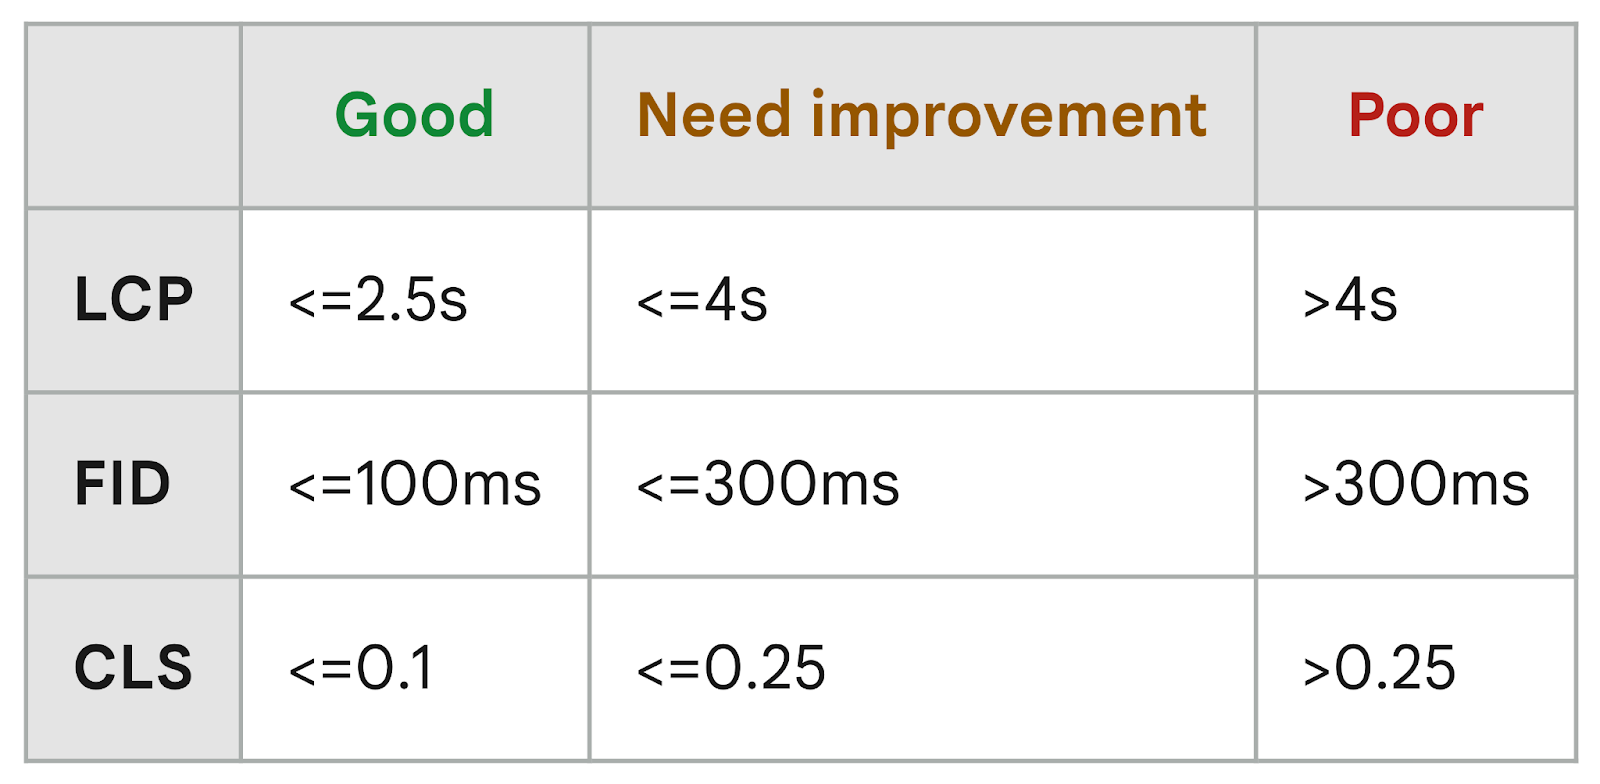
The Core Web Vitals are part of a bigger set of quality signals called Web Vitals. This list constantly evolves and includes other relevant metrics like TTFB and FCP.
To learn more, read our guide to Core Web Vitals and how to improve them.
Tools to Check Your Page Load Time
Many tools can measure your page loading speed.
Bear in mind that each tool uses slightly different data, so your results may vary. Which means relying on a single tool can give you limited results.
That’s why it’s good practice to use various tools to check your site’s performance.
We recommend using Google’s PageSpeed Insights and a tool that doesn’t rely on Google’s data (like GTmetrix or Pingdom).
This will provide a broader view of your site’s health.
Depending on the tool, you’ll get results that use lab data, field data, or both.
Let’s see the differences:
- Field data represents real users visiting your site. It’s also known as Real User Measurement (RUM). It provides a clear picture of your site's performance based on actual user conditions.
- Lab data (or synthetic measurement) comes from a controlled environment simulating specific device and network conditions. It’s helpful for debugging issues and testing features.
Now that we’ve covered the basics, let’s analyze some of the best page speed tools.
Google PageSpeed Insights
Google PageSpeed Insights (PSI) is a free tool that measures a webpage’s performance.
Use it to check the Core Web Vitals for any URL, see performance data, and get recommendations for improvement.
PageSpeed Insights uses both lab data and field data.
It collects lab data from Google Lighthouse (more on that tool later) and field data from the Chrome User Experience Report (CrUX) data set.
To begin, go to PageSpeed Insights and paste the URL you want to measure into the search bar.
Note: You can only check one URL at a time—not a full site.
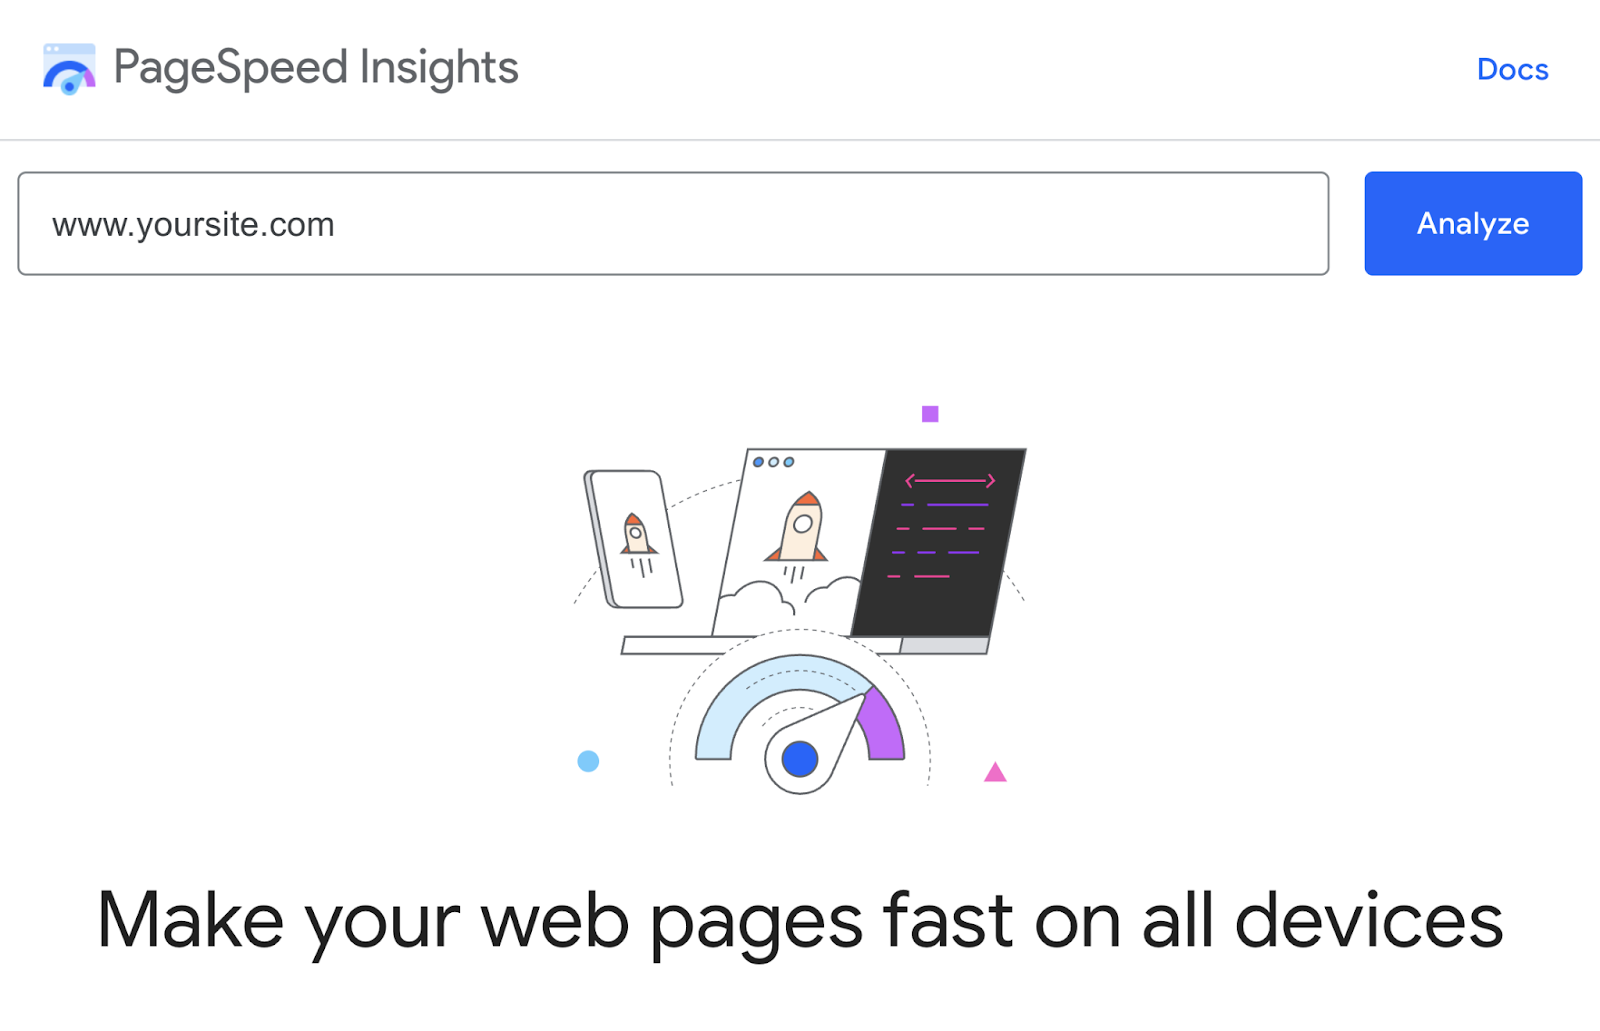
PageSpeed Insights shows statistics and recommendations for both desktop and mobile.
And shares valuable information about your page’s performance, accessibility, best practices, and SEO.
Read our PageSpeed Insights guide to learn how to improve your results.
Google Lighthouse
Google Lighthouse is a free tool that analyzes a site’s performance and user experience. It flags issues and shares suggestions to fix them.
Google Lighthouse uses lab data. And lets you analyze the performance of a full site—not just a single URL.
It reports on the following:
- Performance (via Core Web Vitals)
- Accessibility
- Best practices
- SEO
- Progressive Web Apps
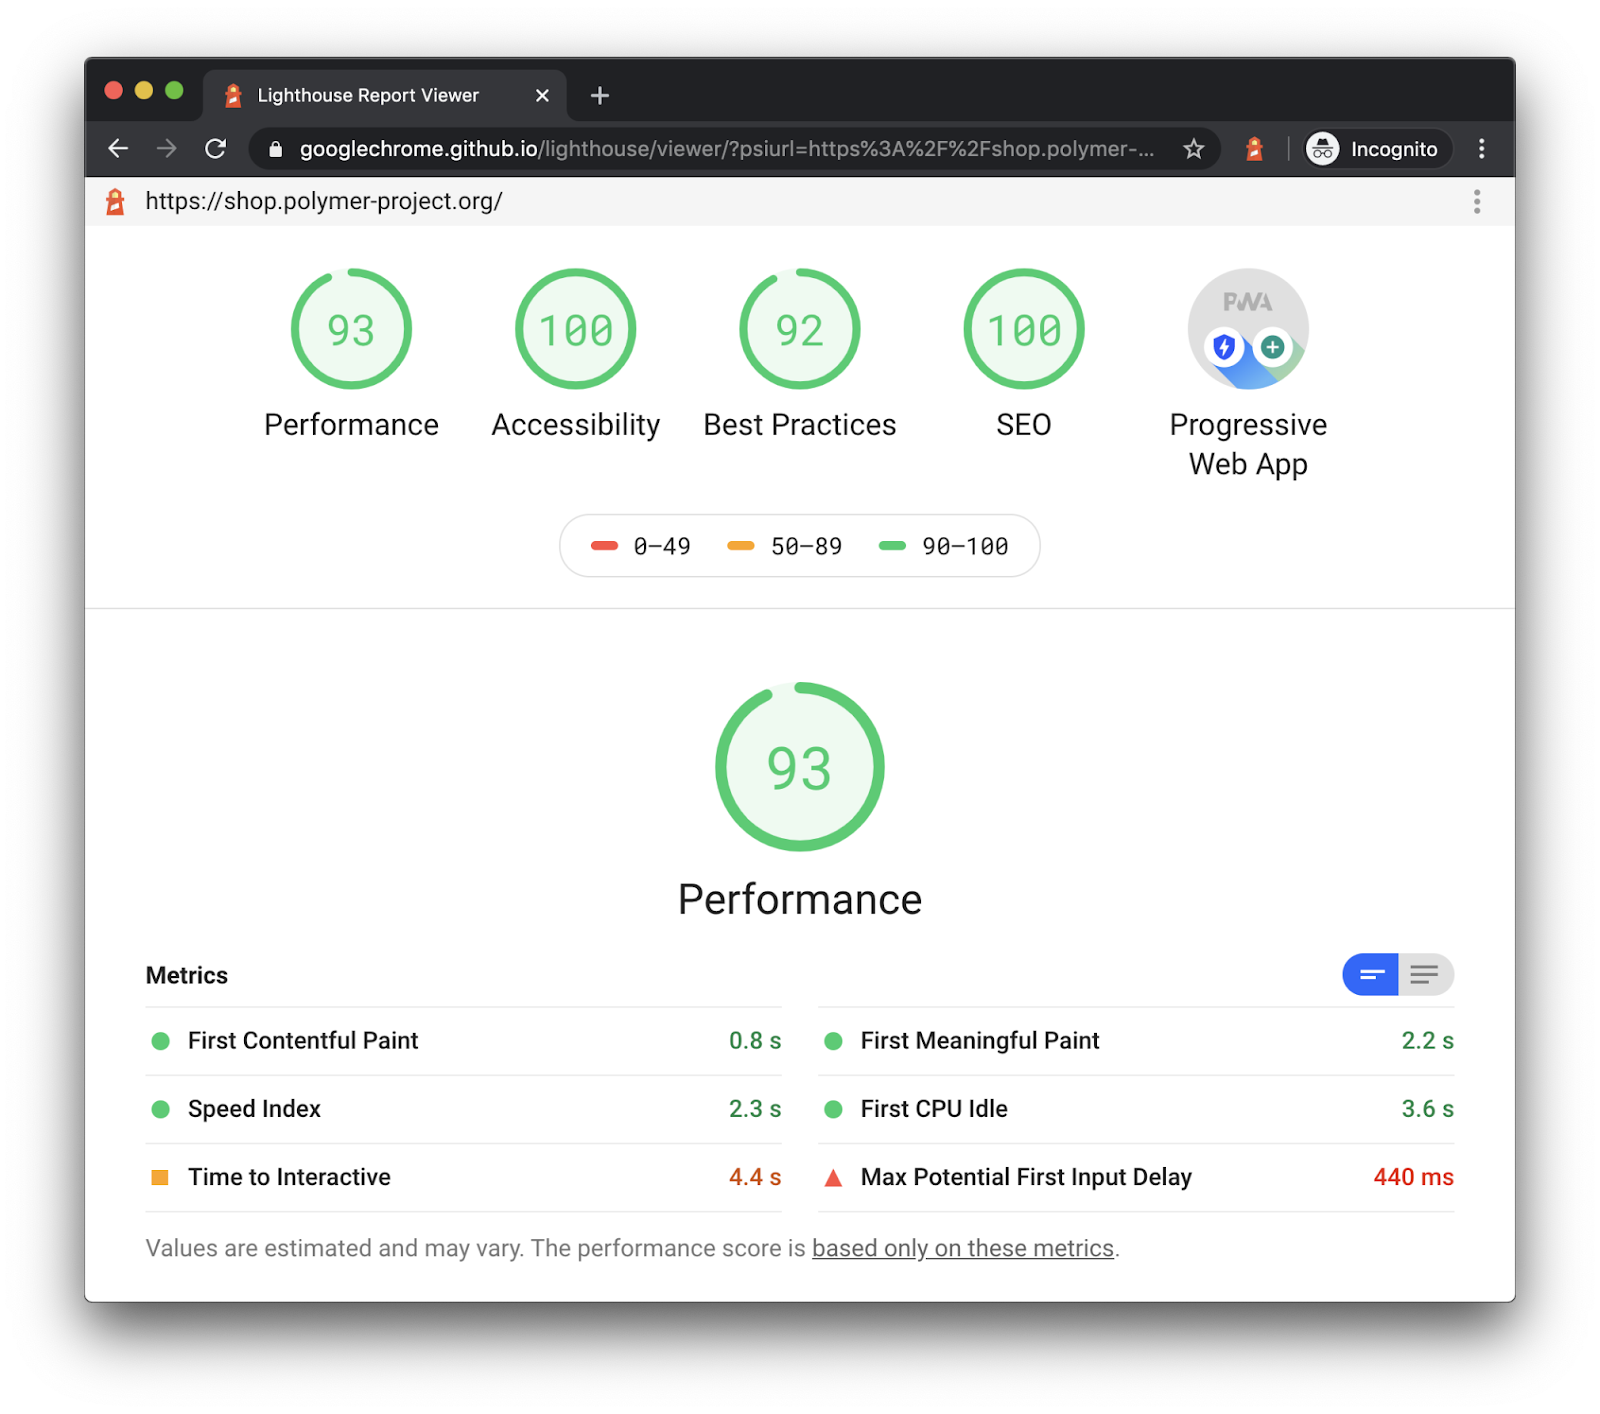
You can use Google Lighthouse in different ways:
- Chrome DevTools (through Google Chrome’s “Inspect” option)
- Chrome extension
- Web User Interface (UI)
- Node module
To learn more, read our guide to Google Lighthouse and page speed.
WebPage Test
WebPage Test lets you run customized page load time tests based on different user conditions. Like location, browser, connection, etc.
So you can see how different users experience your page.
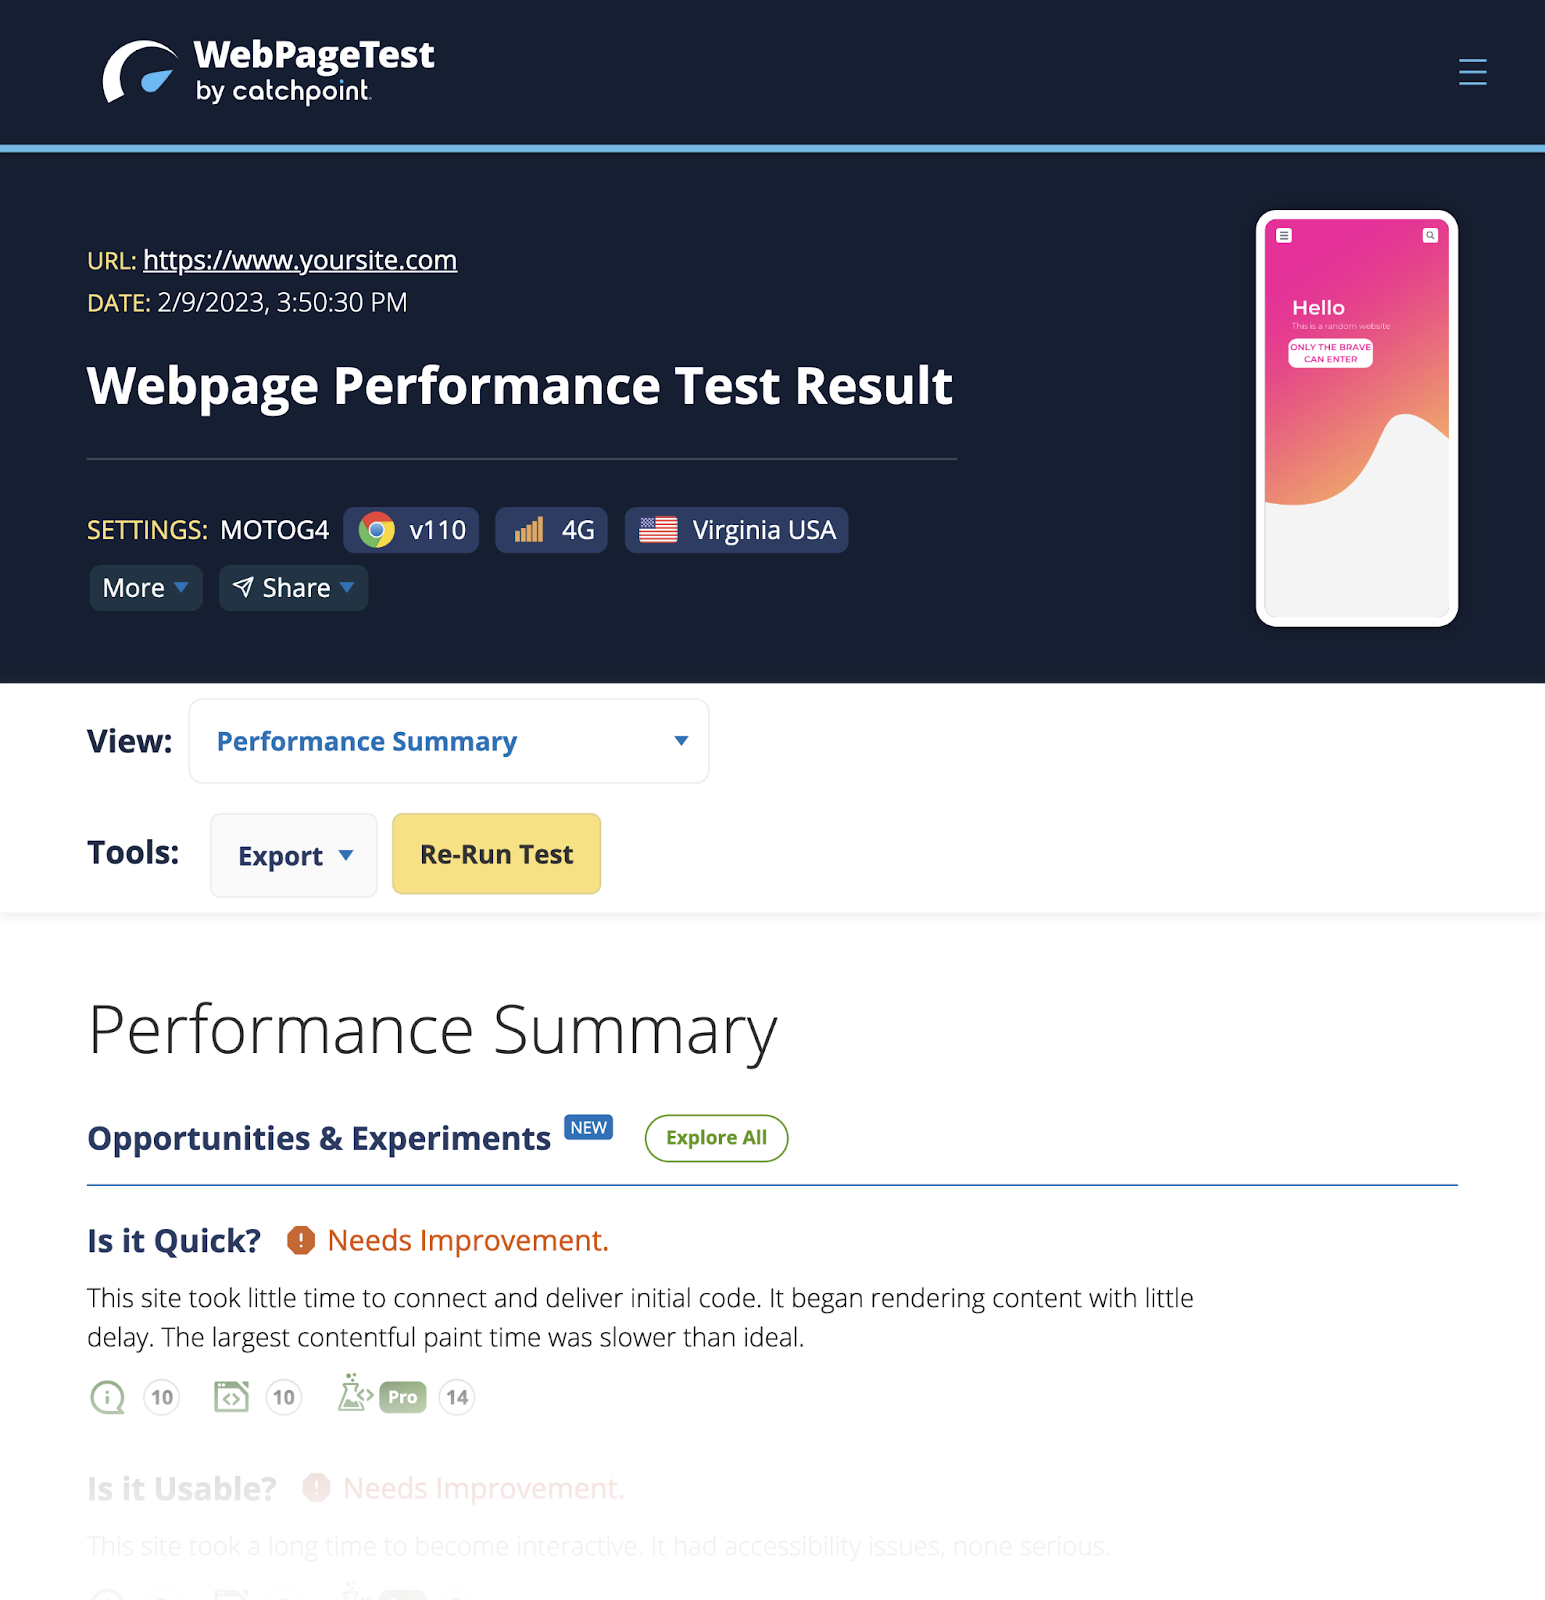
WebPage Test generates the following results:
- A waterfall graph to understand how the different elements on your site load
- Relevant metrics like TTFB, FCP, and total loading time
- Your Core Web Vitals (note that these may not match your PageSpeed Insights results, as the data is different.) Using both is a good way to see the big picture.
- And more
To start, visit WebPage Test, scroll down, and type your URL into the search bar.
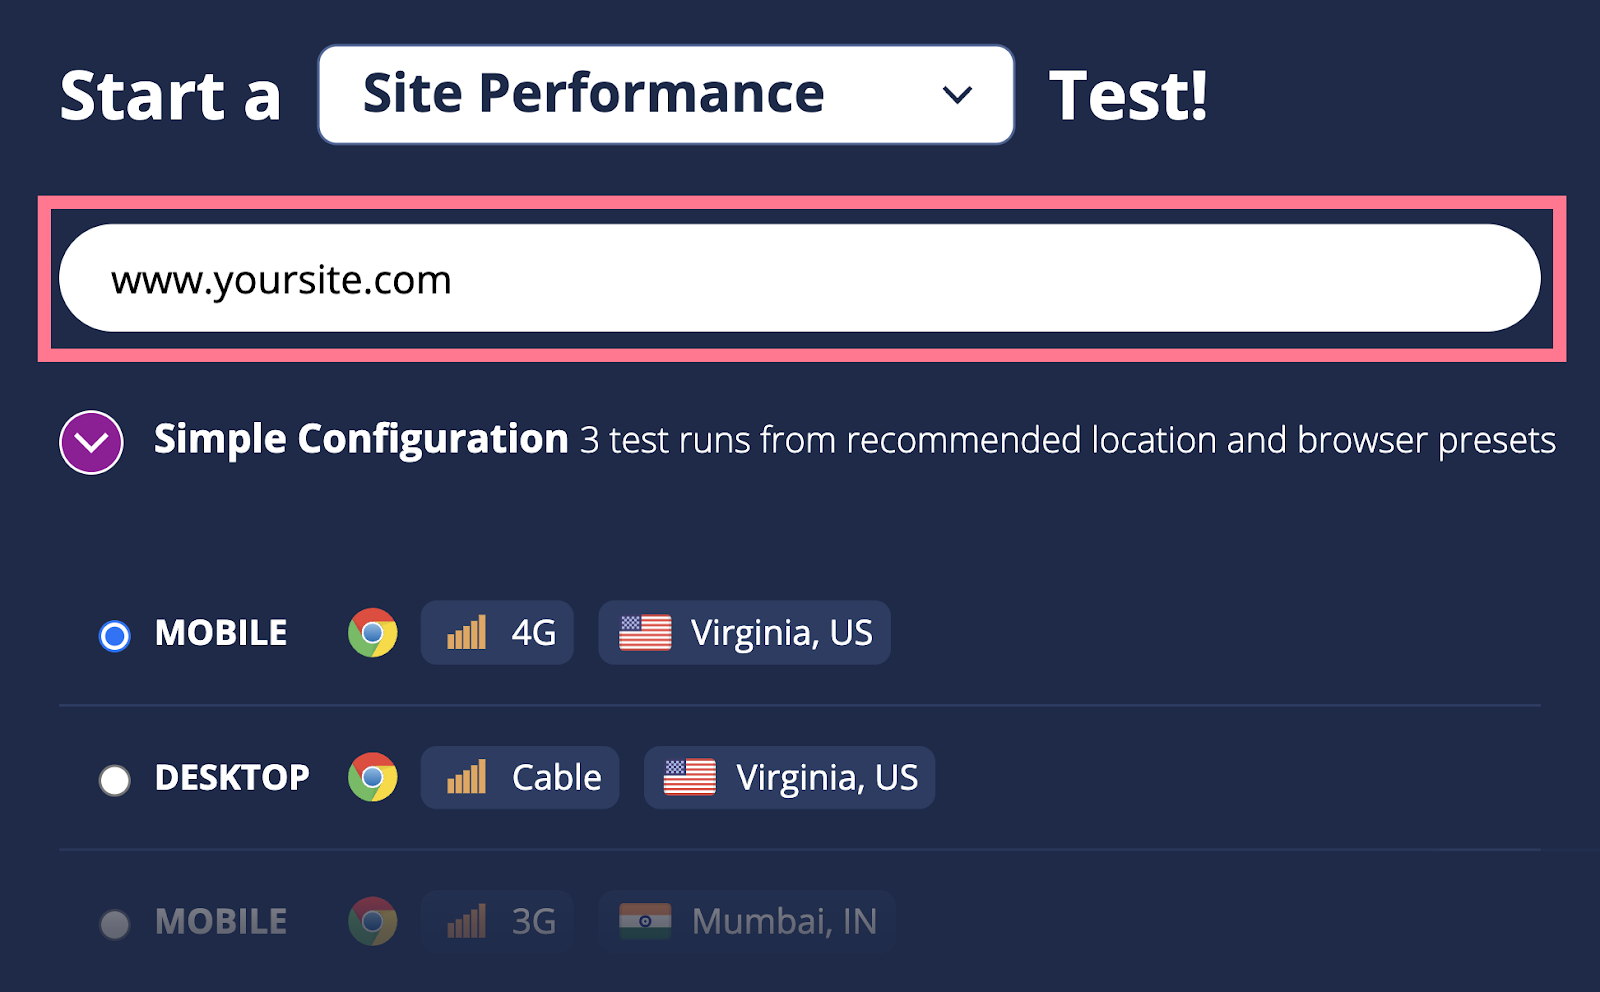
If you select the “Simple Configuration” option, you’ll need to choose between a list of preset conditions. The tool recommends locations and browser presets:
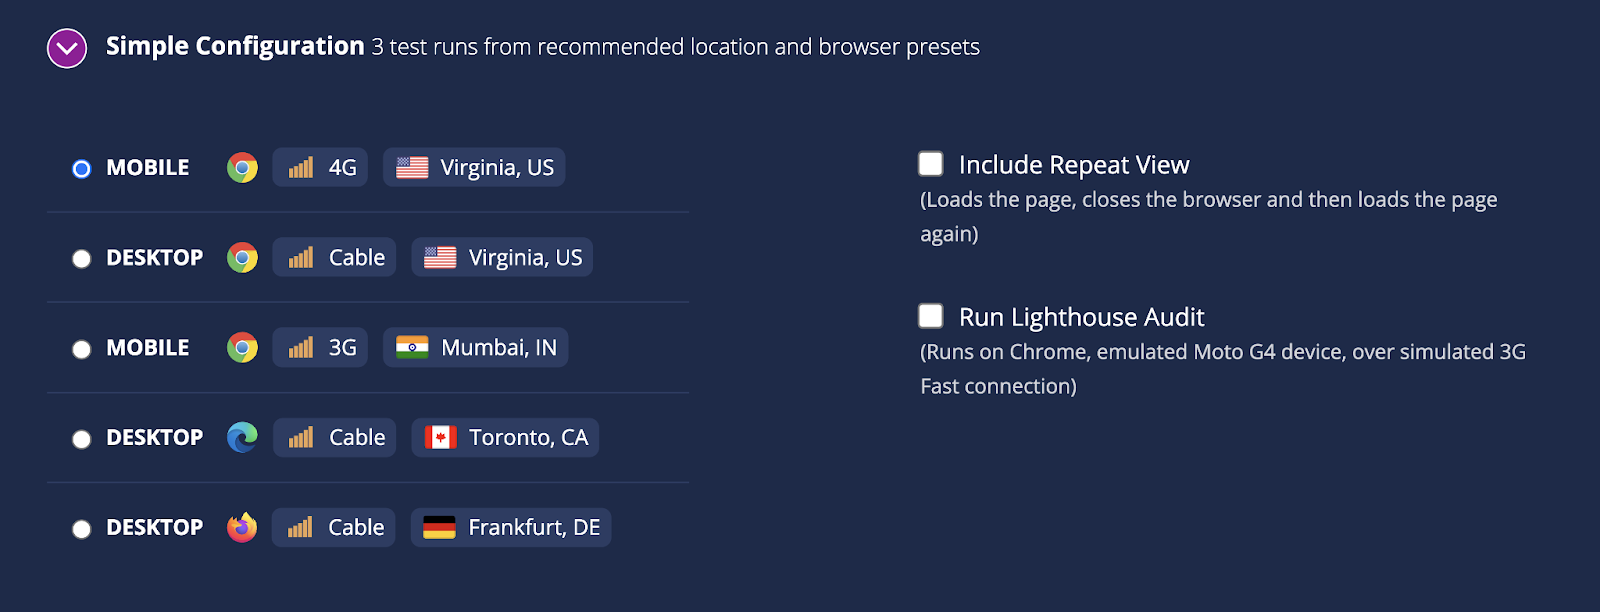
After selecting your conditions, click “Start Test.”
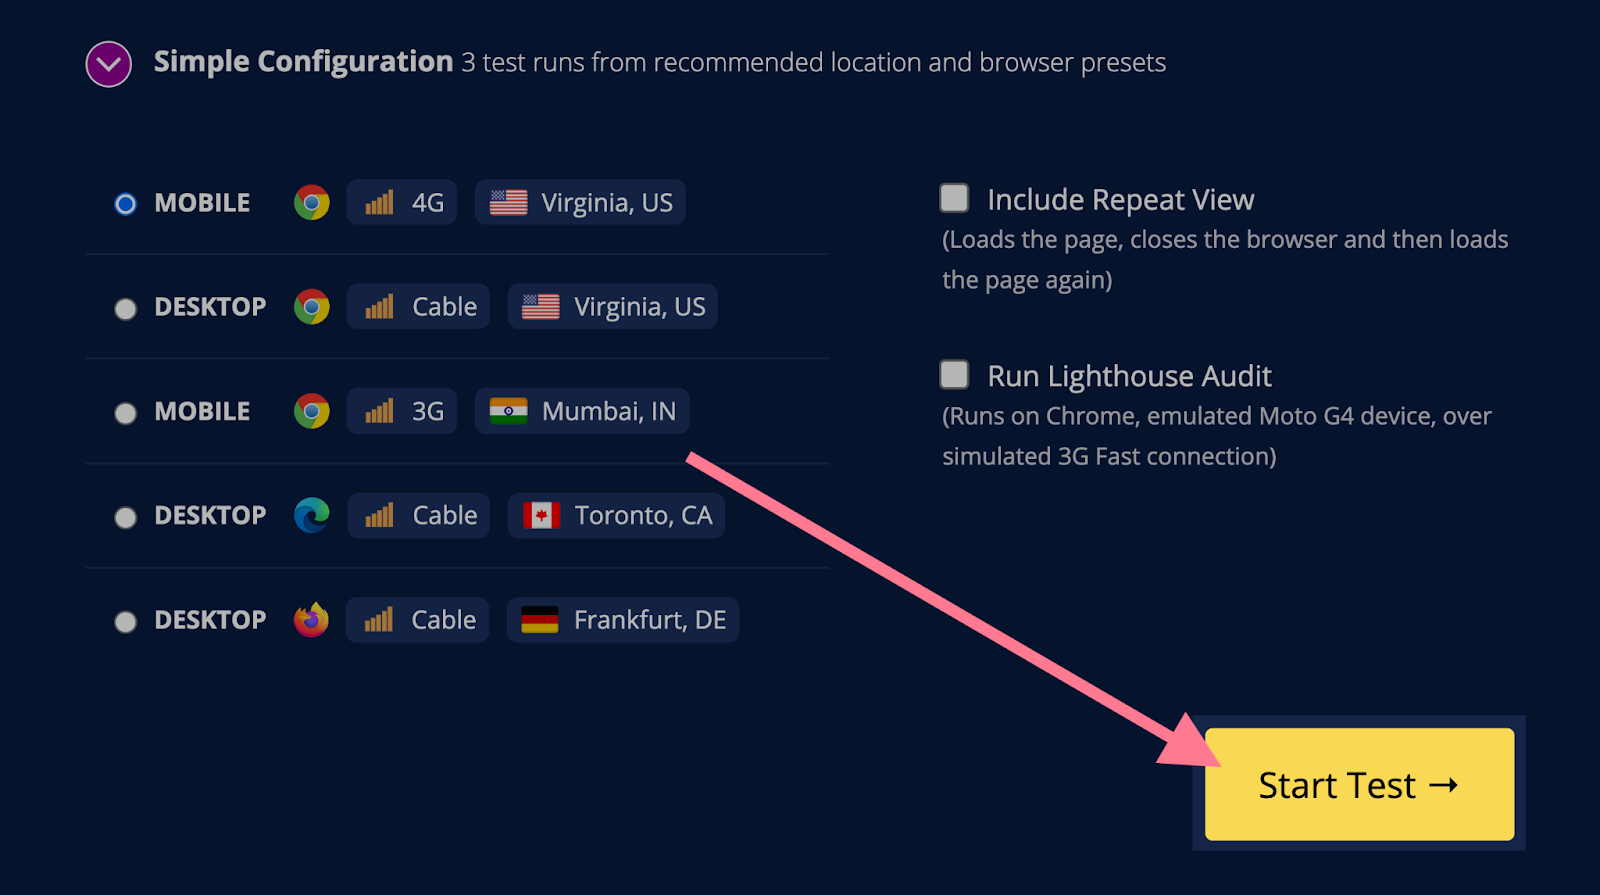
Tip: Don’t know which option to select? Choose the country your target audience is closest to.
If none of these preset conditions meet your needs, select “Advanced Configuration” to customize your test.
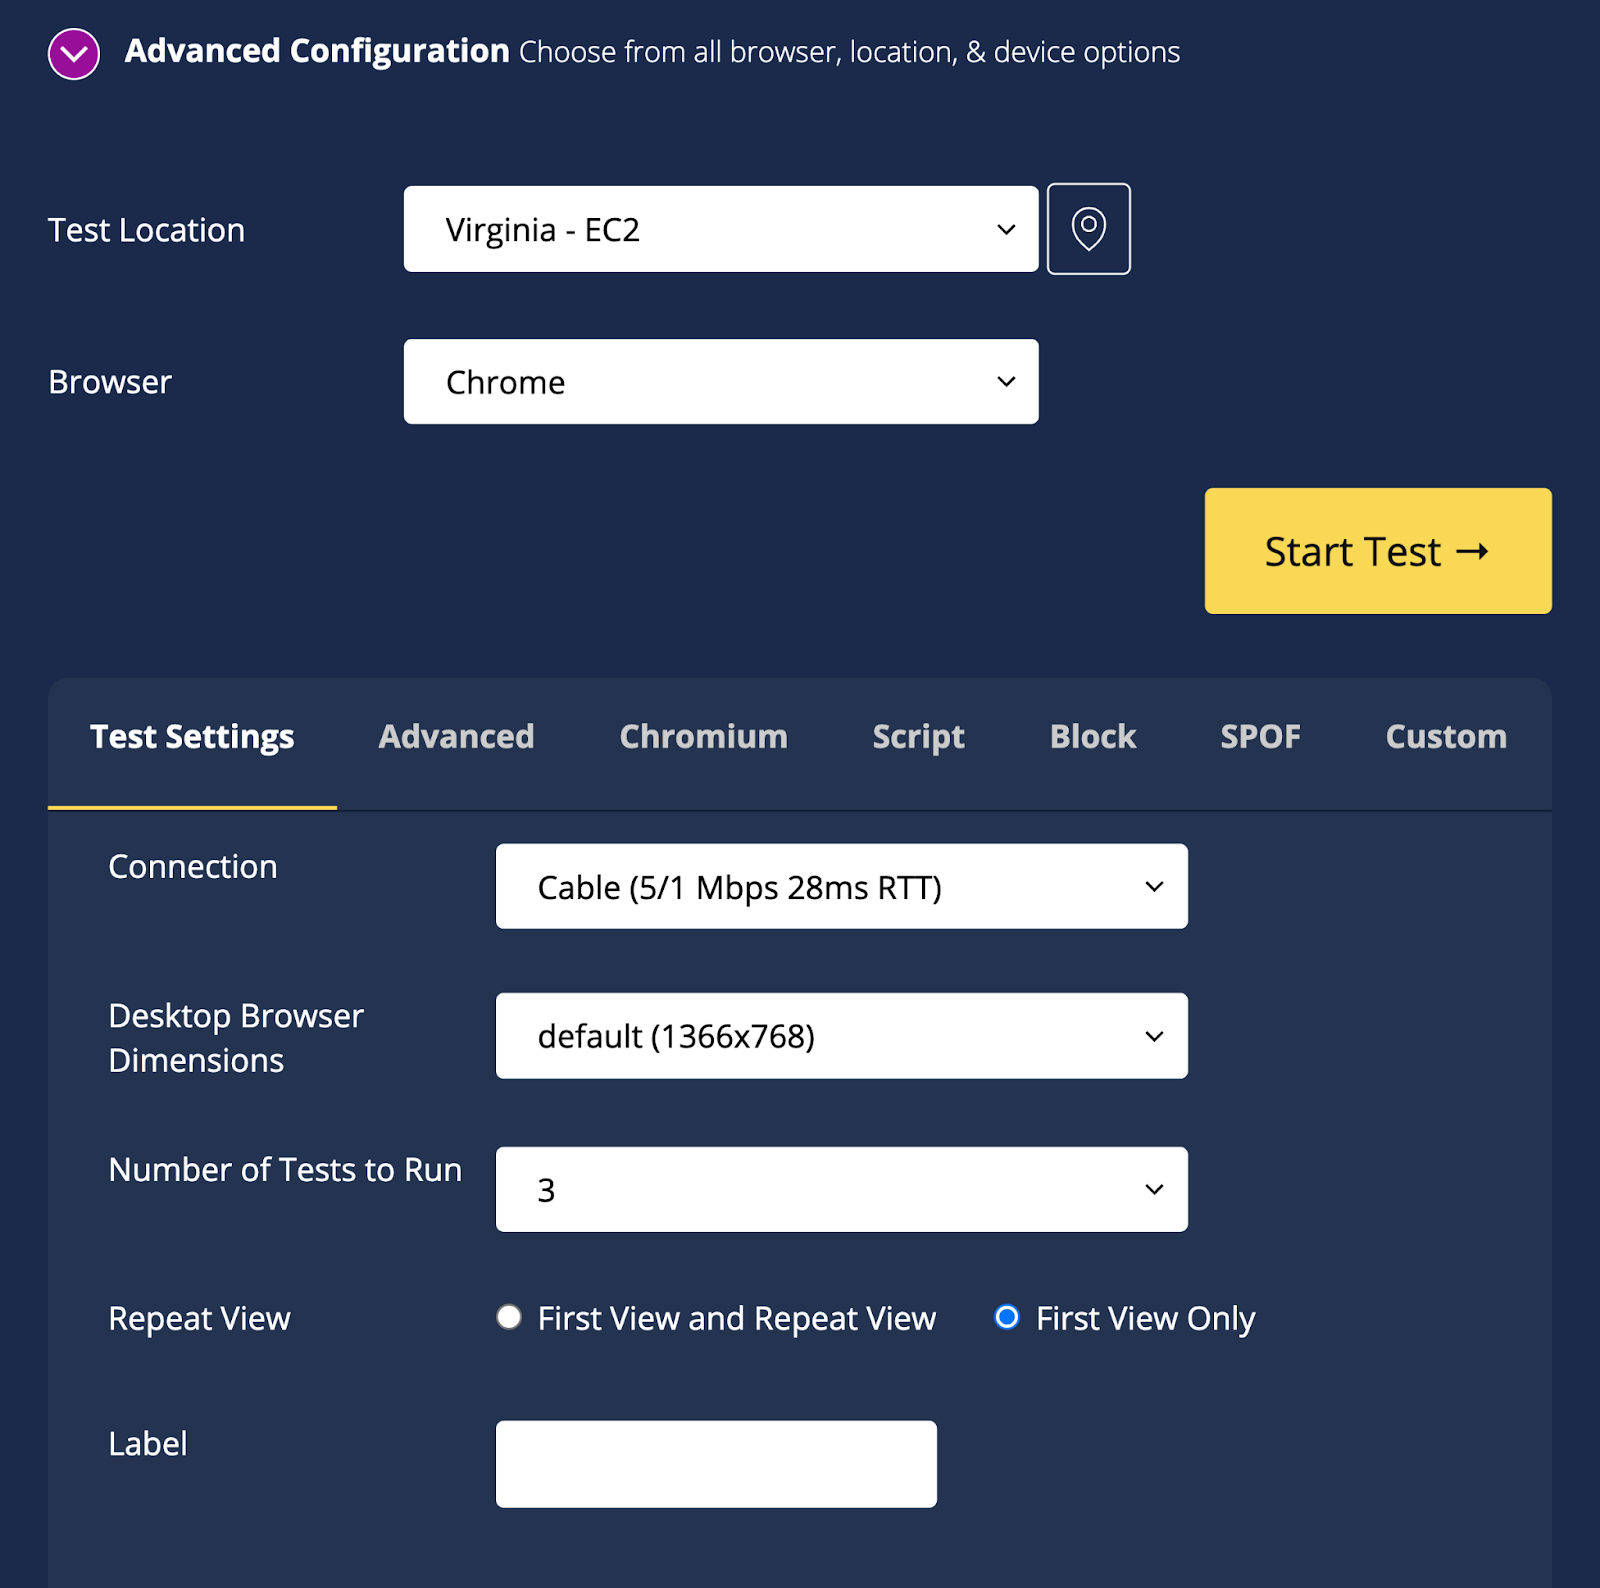
The results look like this:
Pingdom Website Speed Test
The Pingdom Website Speed Test is a free tool that analyzes a page’s load time and shares recommendations to improve it.
This tool analyzes a specific URL rather than your entire site.
Go to the Pingdom Website Speed Test and enter a URL.
Then choose the location of the server. Pick the one closest to your users. (If you have a global site, run different tests and compare the results.)
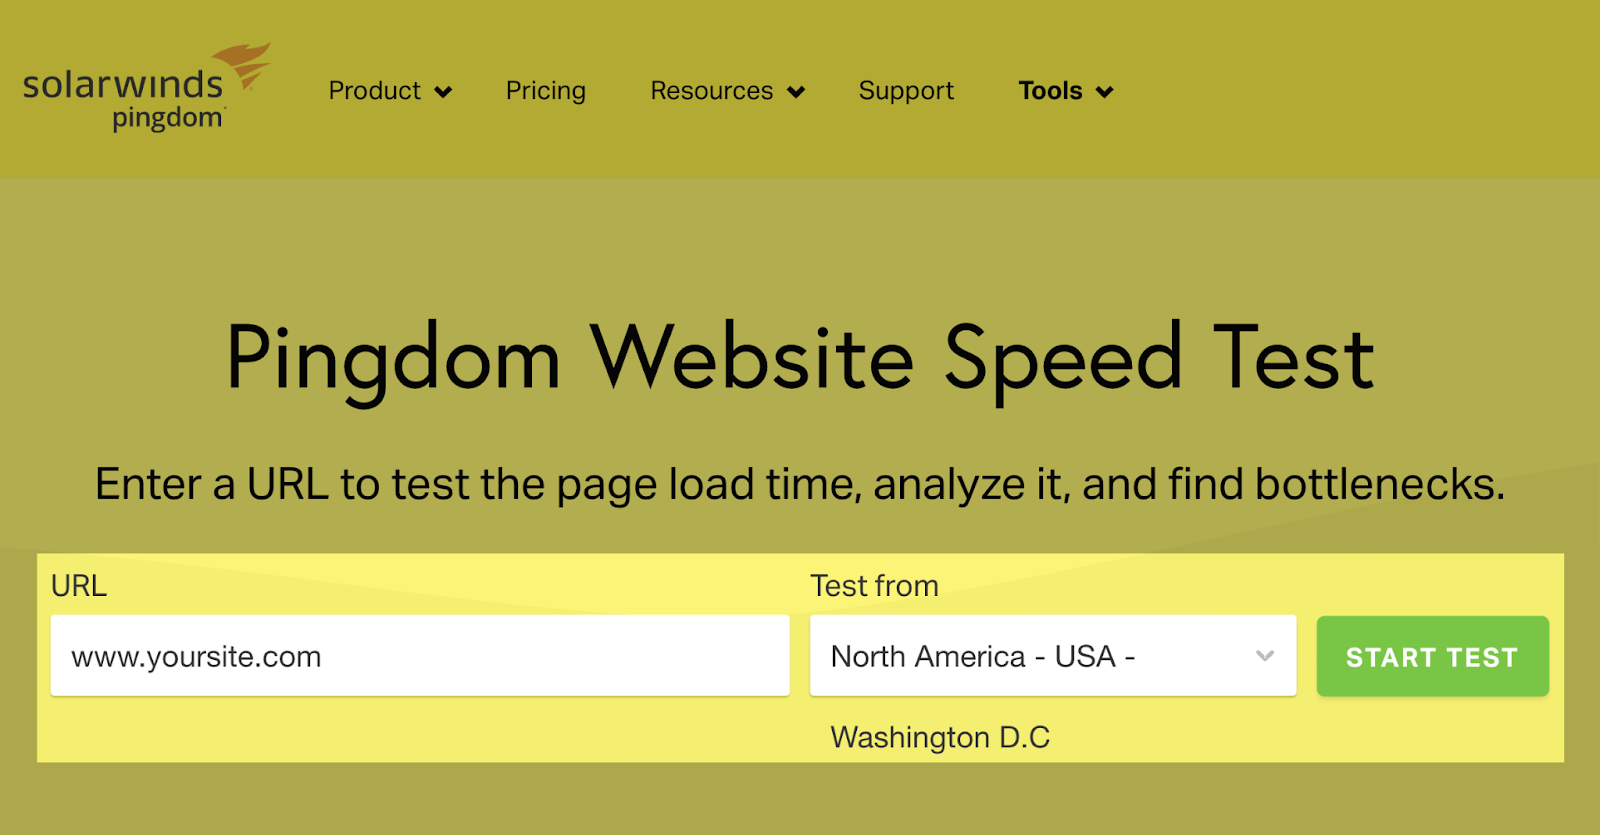
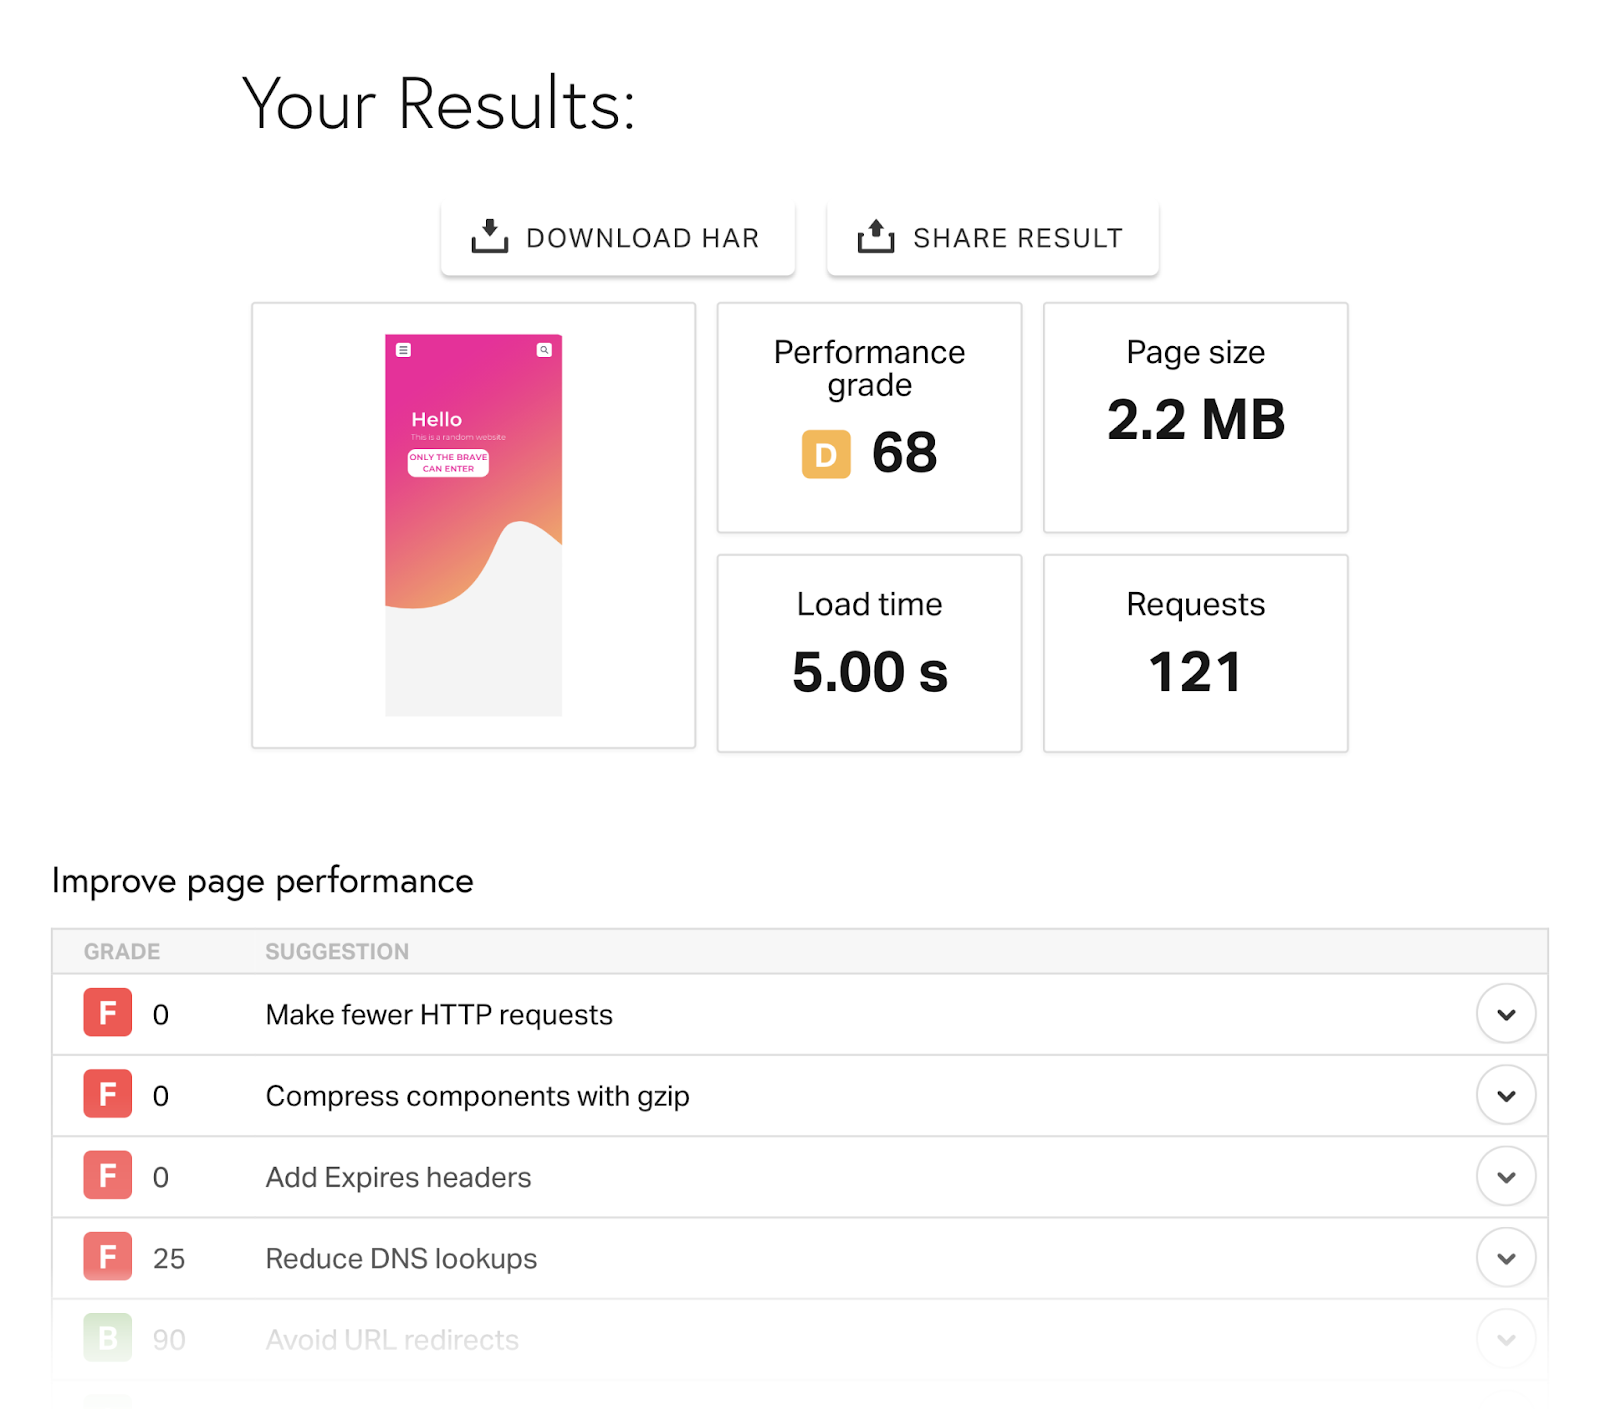
The tool will display your page size, load time, number of HTTP requests, and recommendations.
GTmetrix
GTmetrix is a free tool that measures a page’s performance. You can choose the location for each test.
This tool generates a report that includes the following:
- Your structure score
- Your performance score
- Your Core Web Vitals score
- A speed visualization graphic
- Recommendations to improve performance
- And more
Go to GTmetrix, enter your URL, and click “Test your site.”
You can only check one URL at a time.
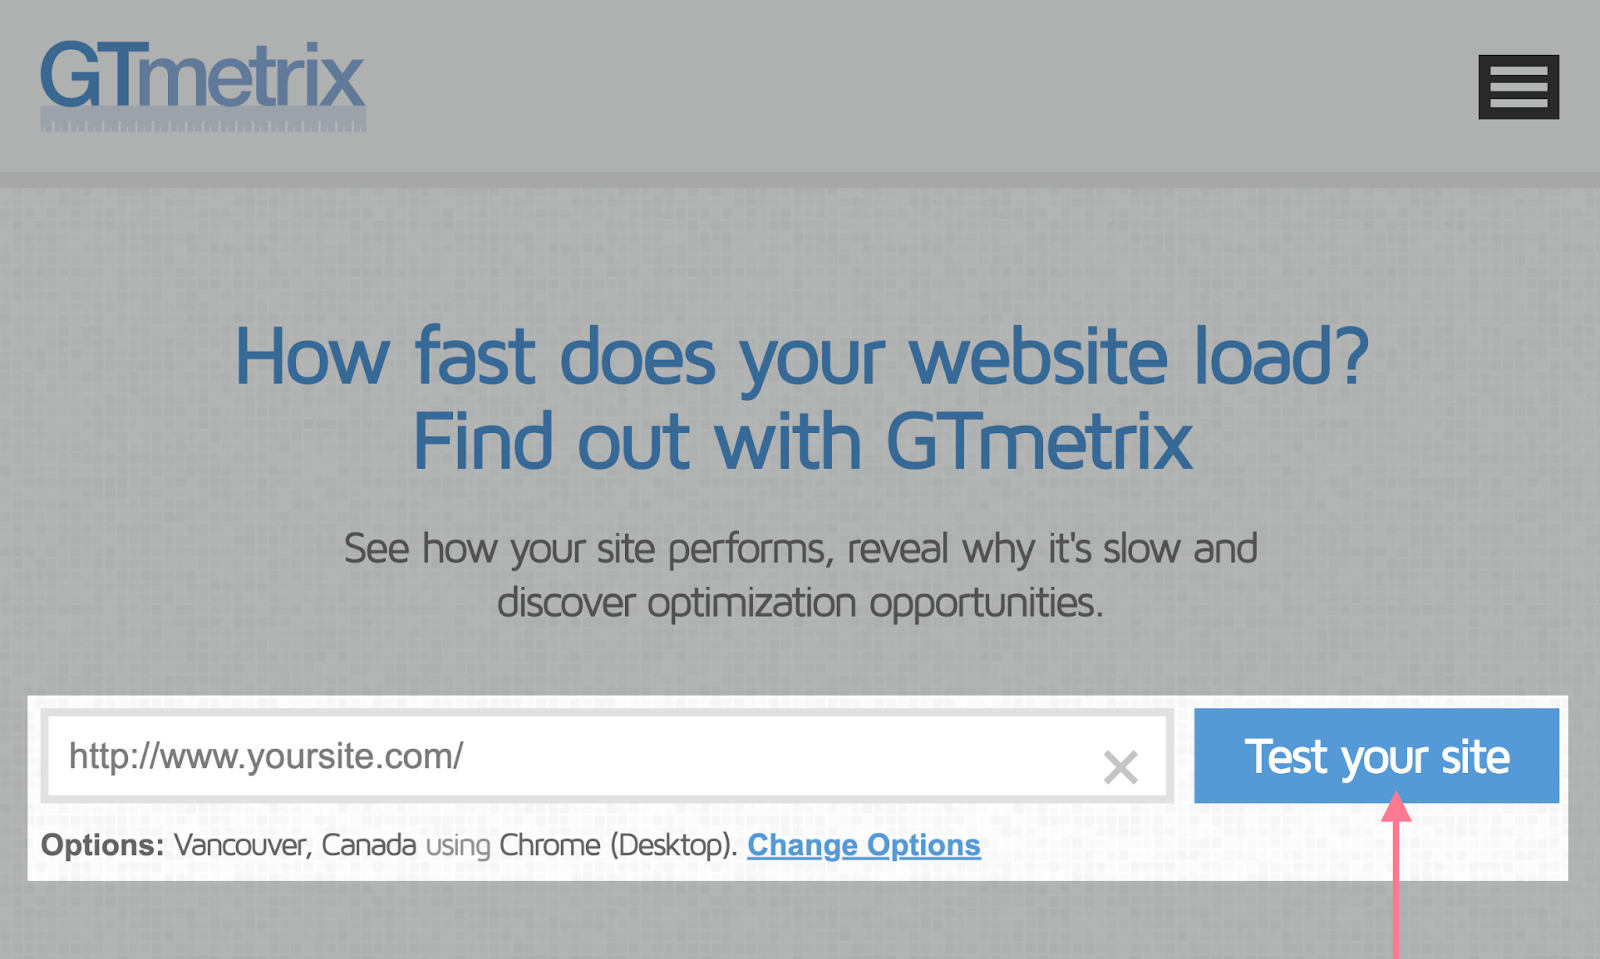
Note: To choose the server’s location for the test, you’ll need to register (for free). Otherwise, the test will use a default server located in Vancouver, Canada.
Here’s is what your GTmetrix report will look like:
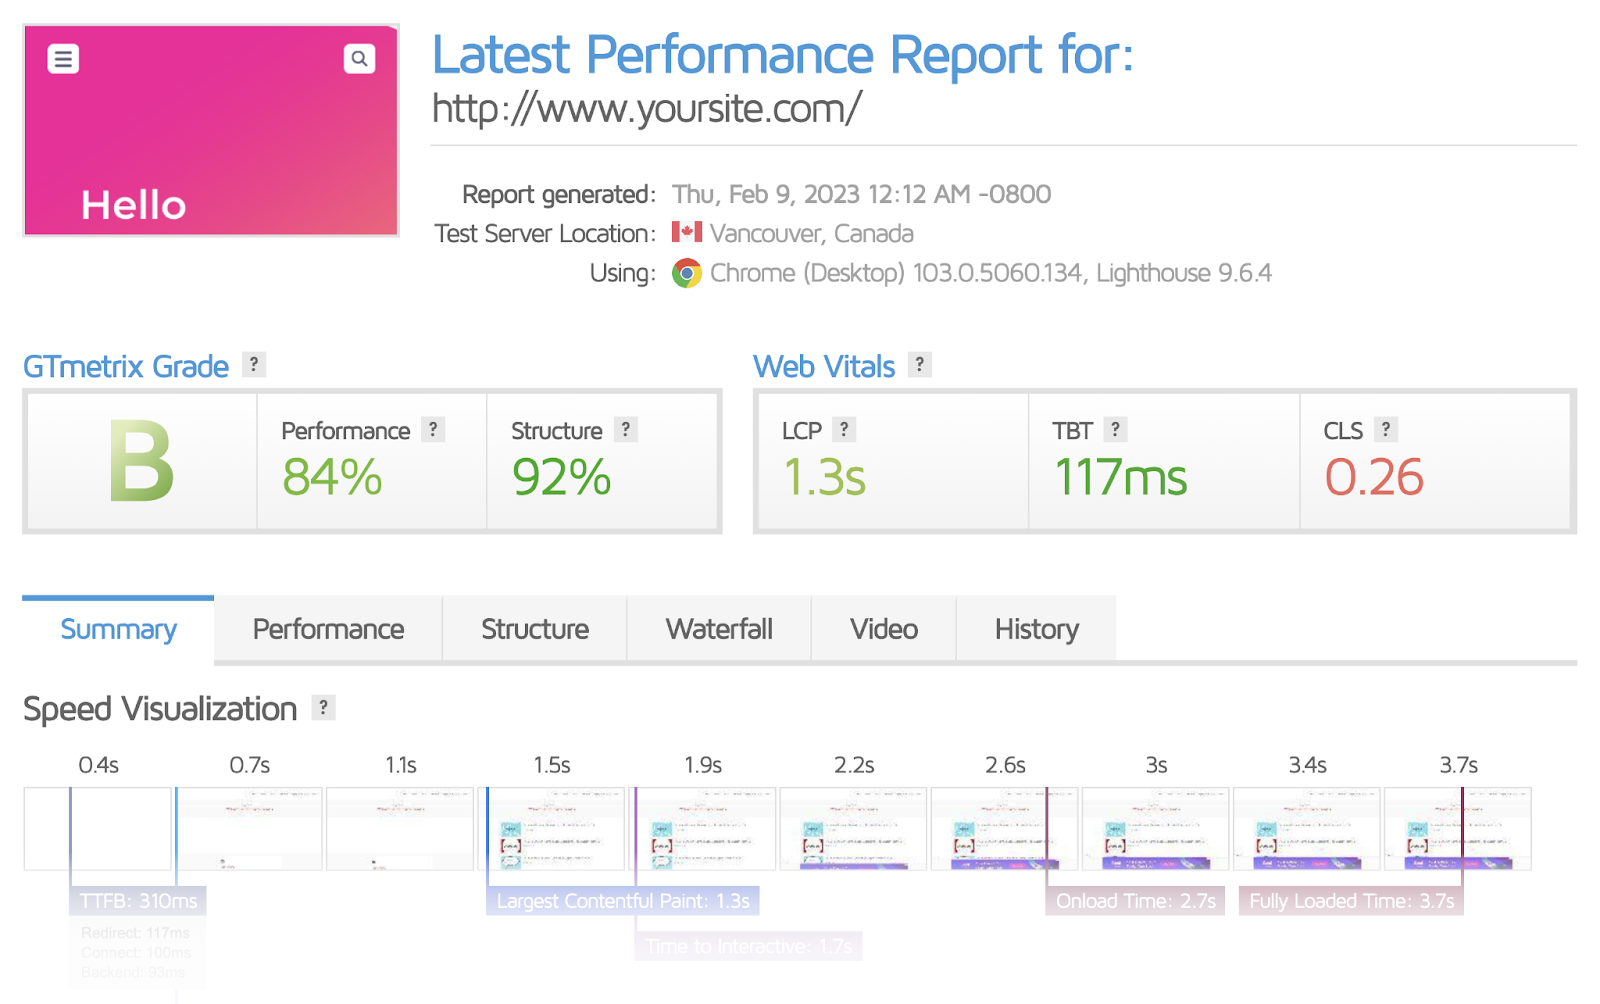
It includes a quick summary right at the top so you can assess performance at a glance. Plus a “Speed Visualization” chart.
Semrush Site Audit
If you want to go one step further (and get page speed information), conduct a full technical audit with Semrush’s Site Audit tool.
Site Audit includes over 140 on-page and technical SEO checks.
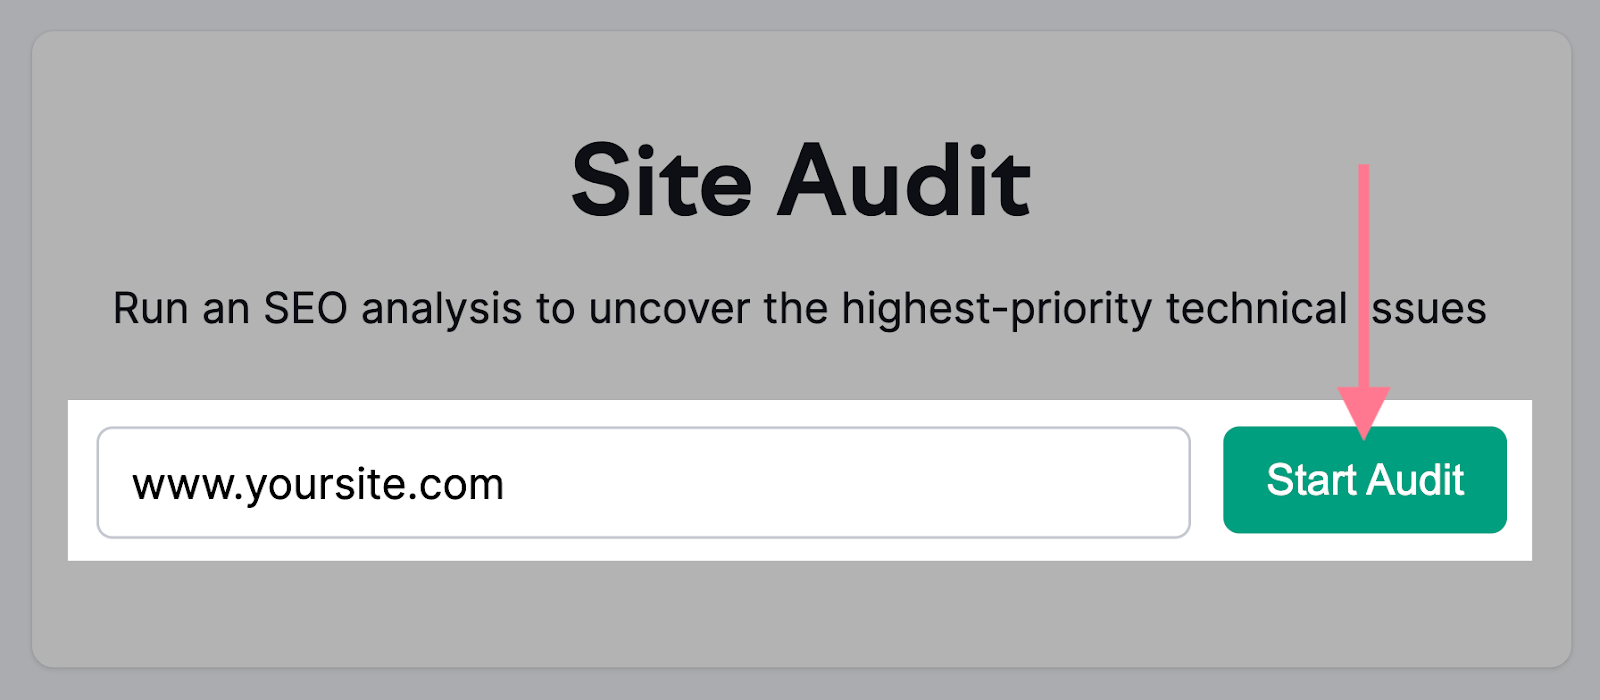
To check a website's loading speed, go to the Site Audit tool, enter your URL in the search bar, and click the “Start Audit” button.
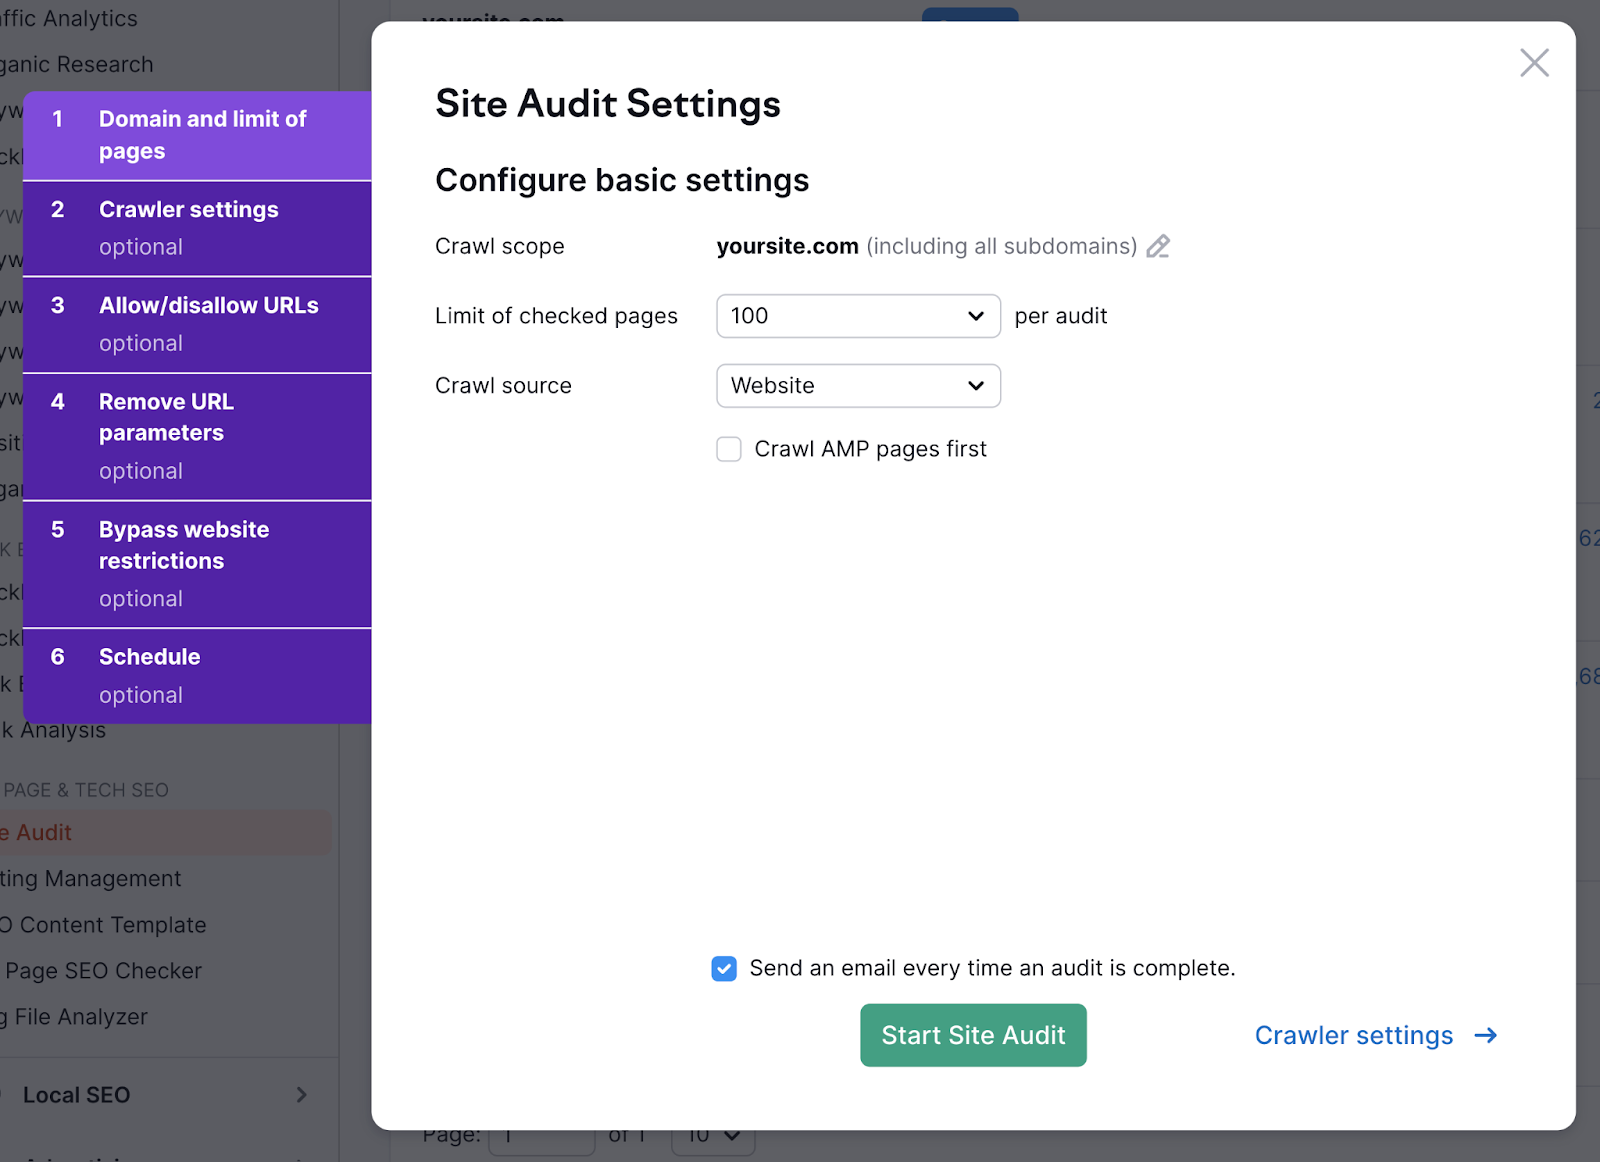
Then, configure your Site Audit. Click “Start Site Audit.”
You’ll see a dashboard similar to this one:
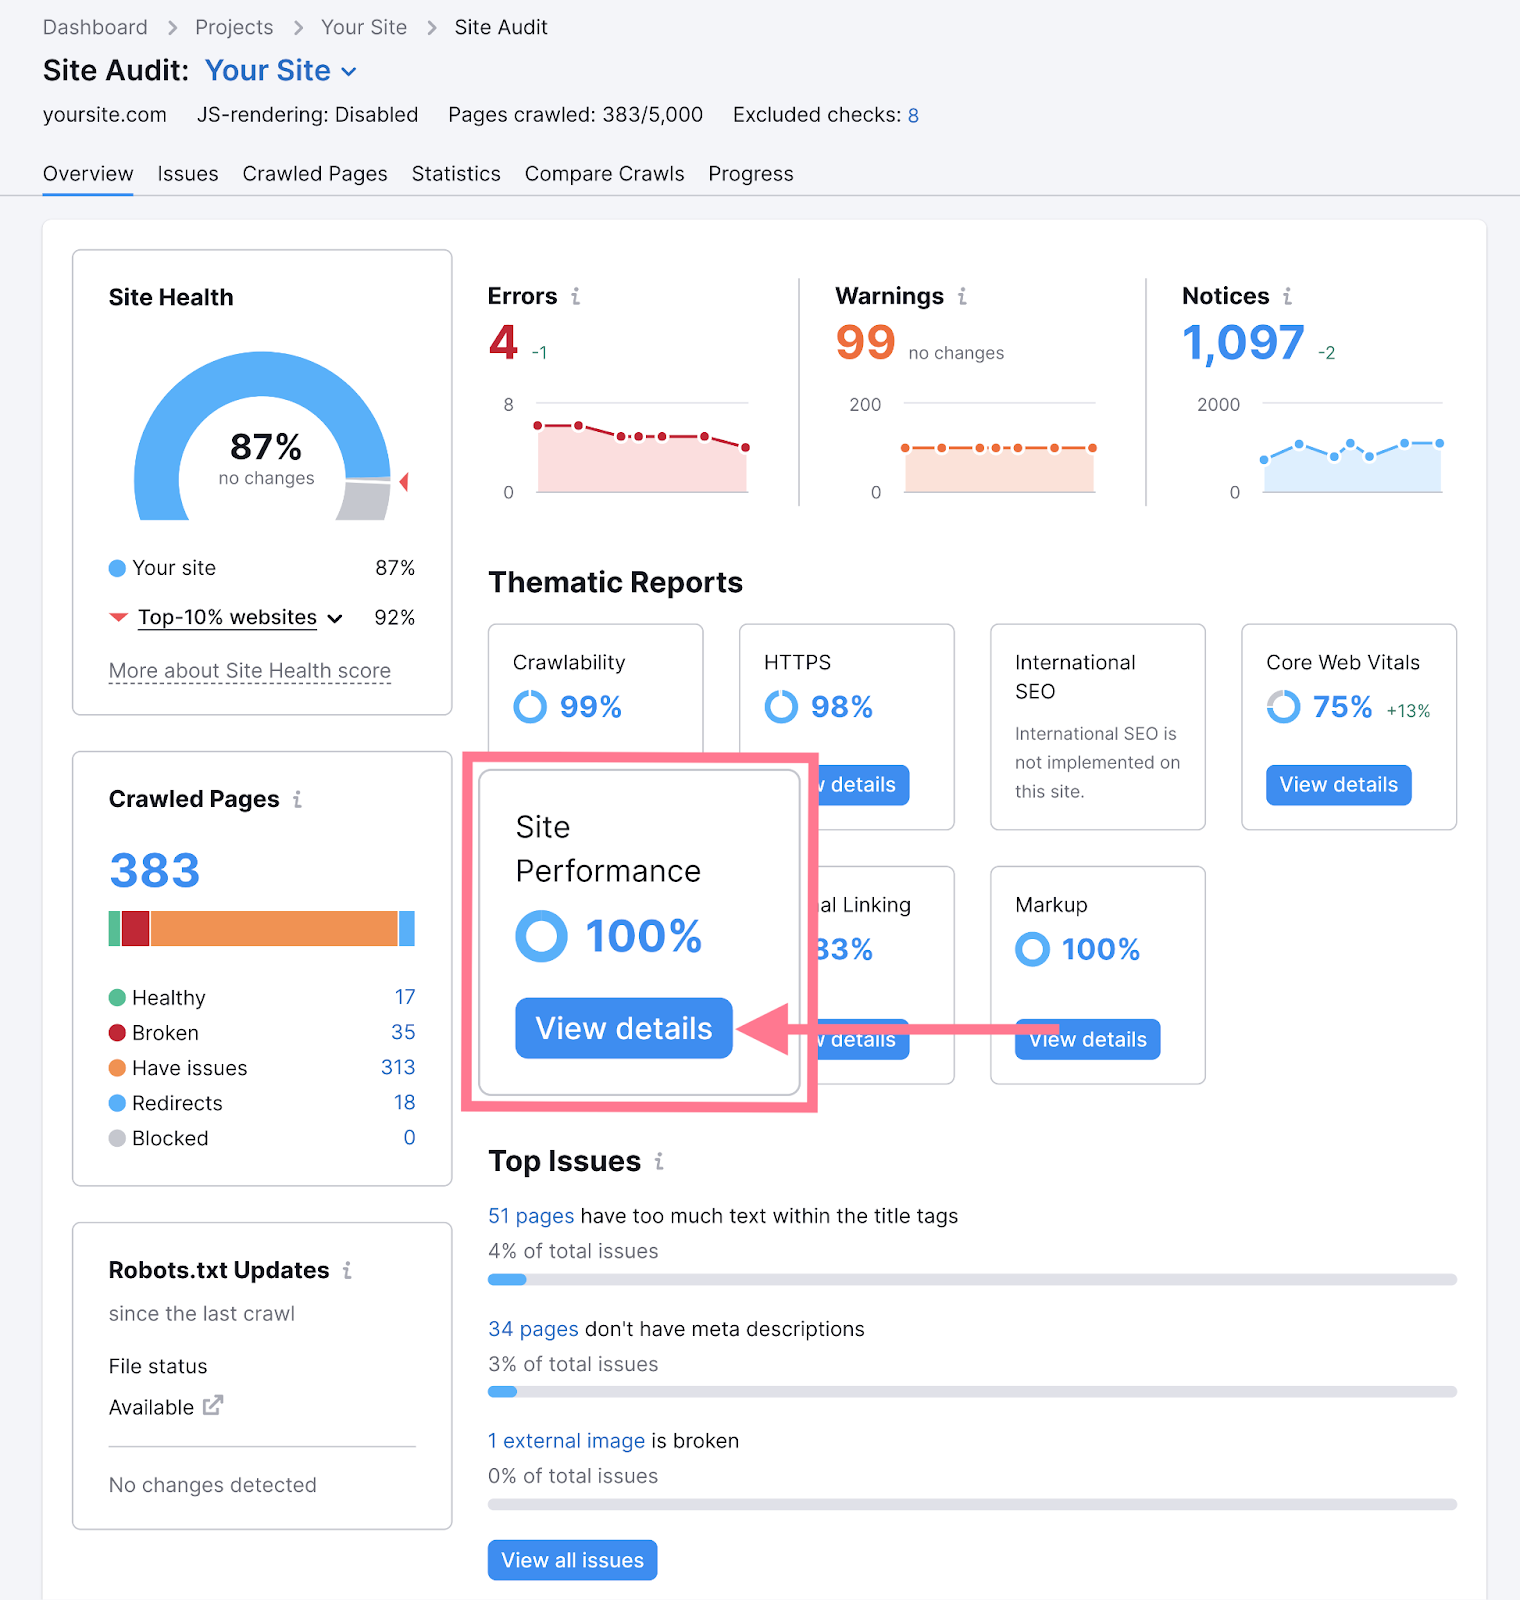
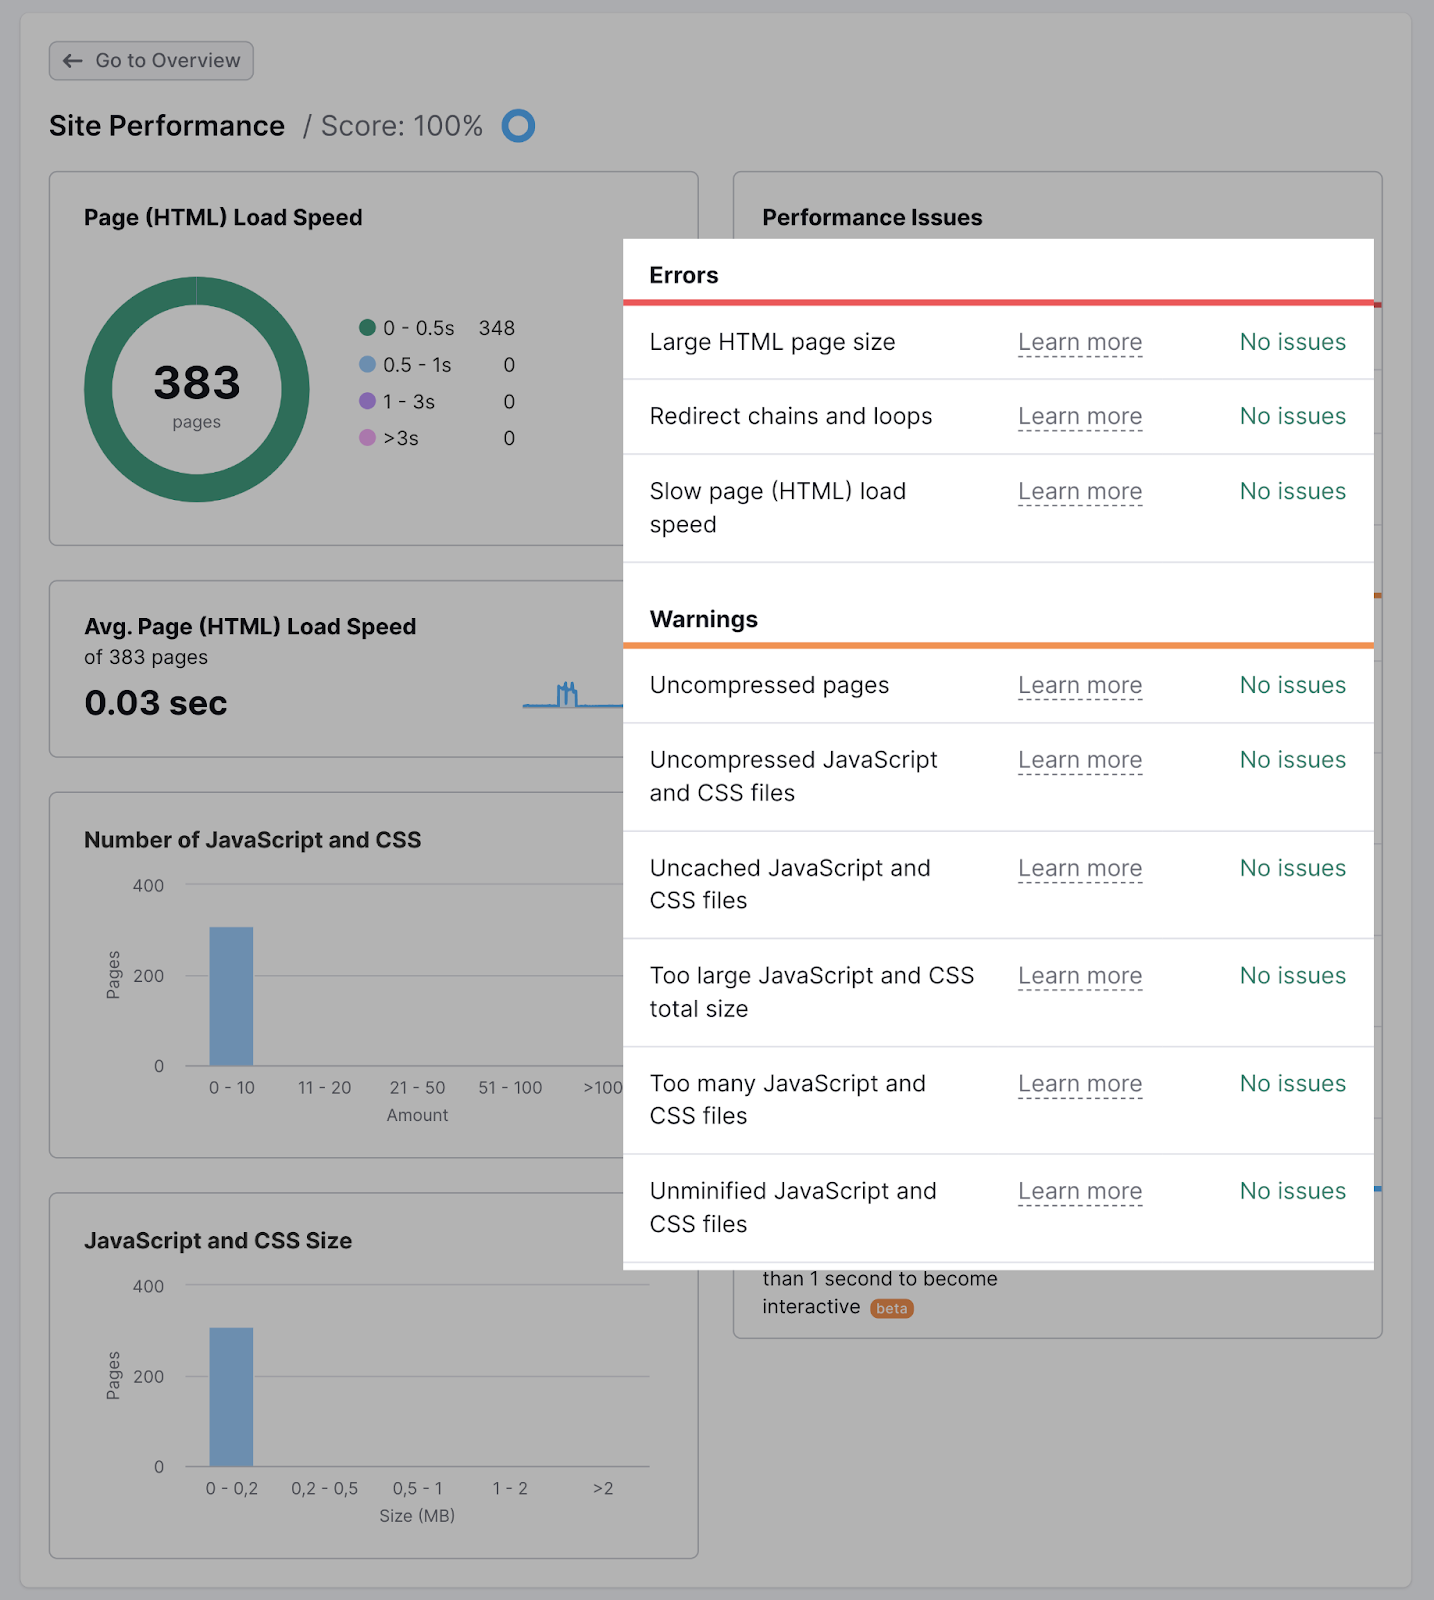
Visit the “Site Performance” report to check your load speed, performance issues, and more.
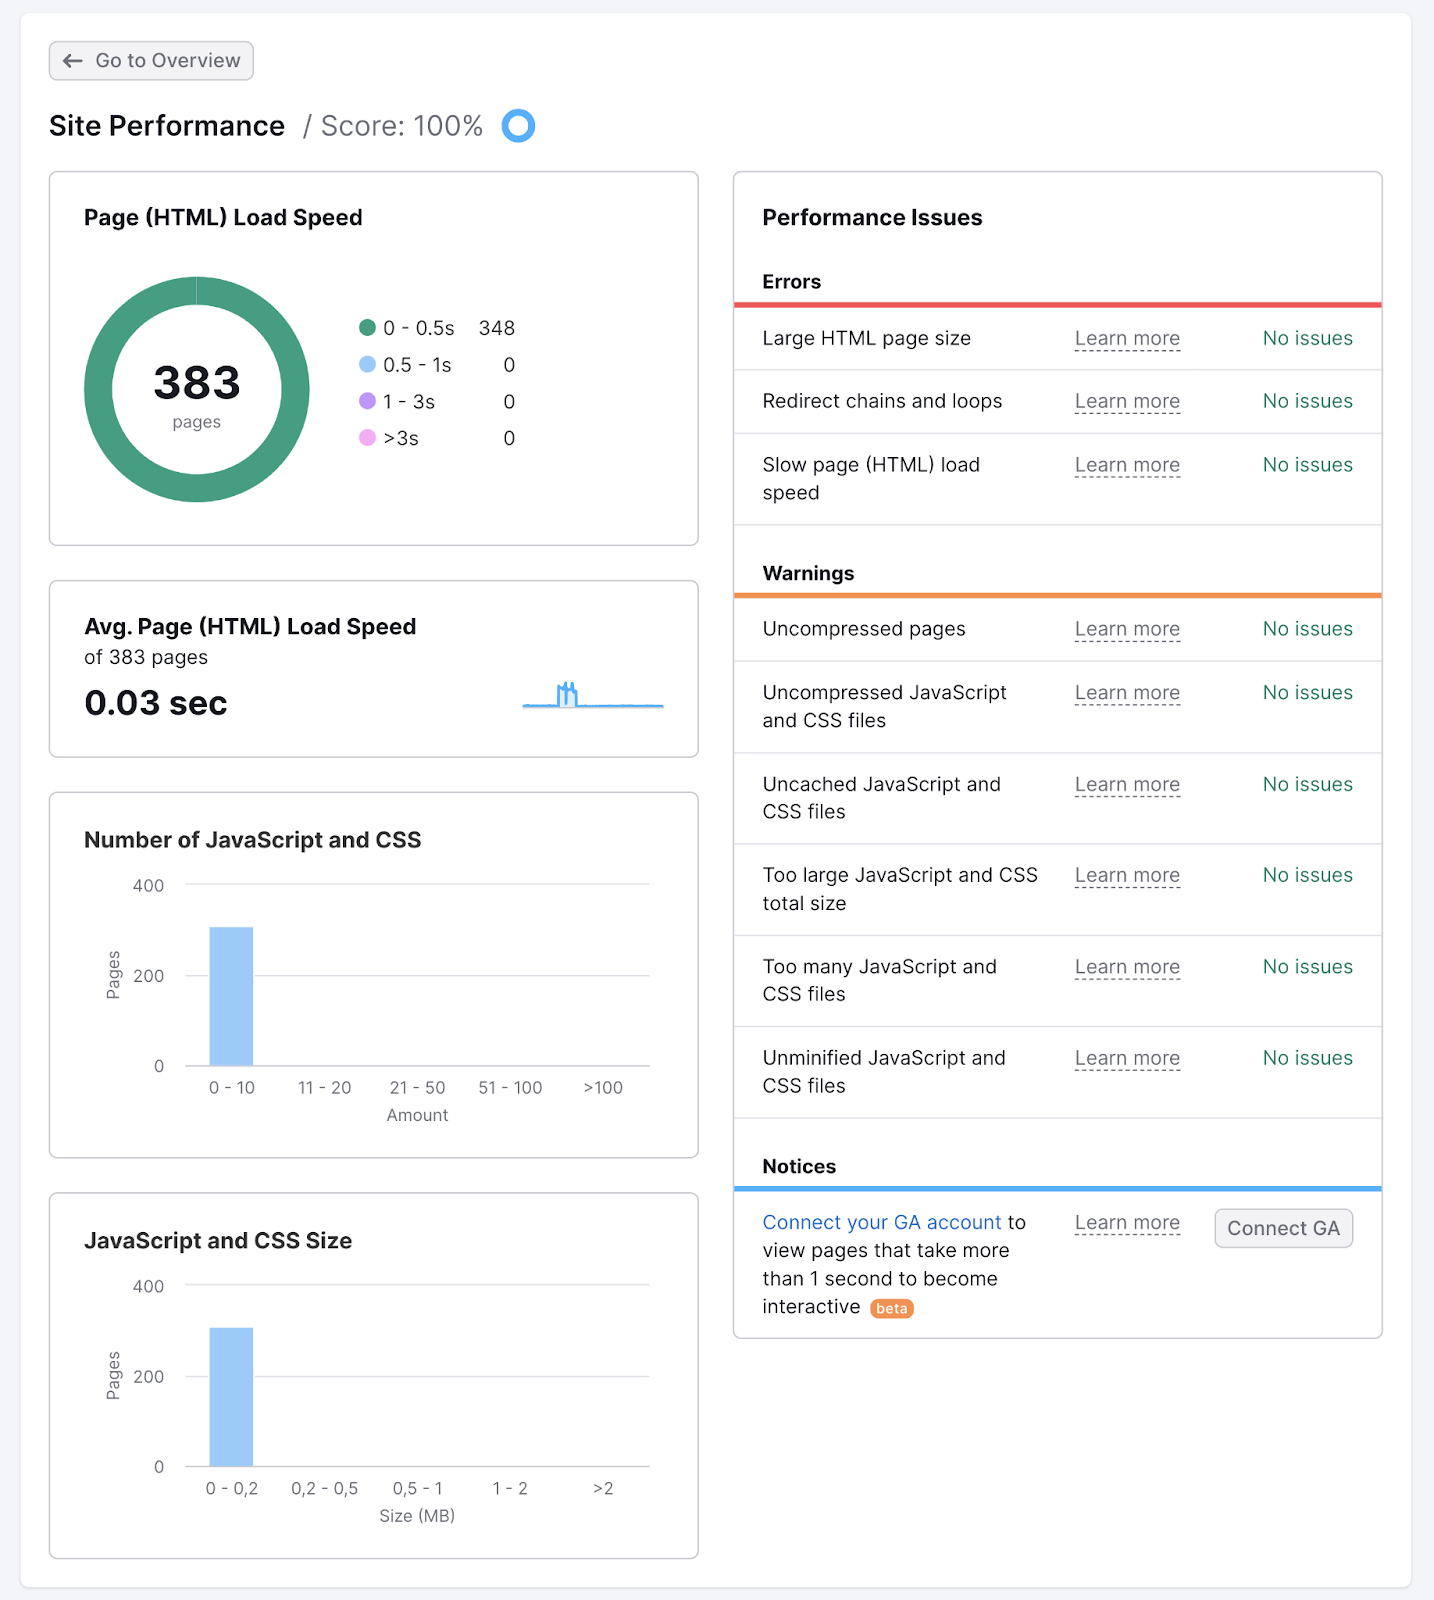
When fixing these issues, prioritize “Errors.” Then, move on to “Warnings.”
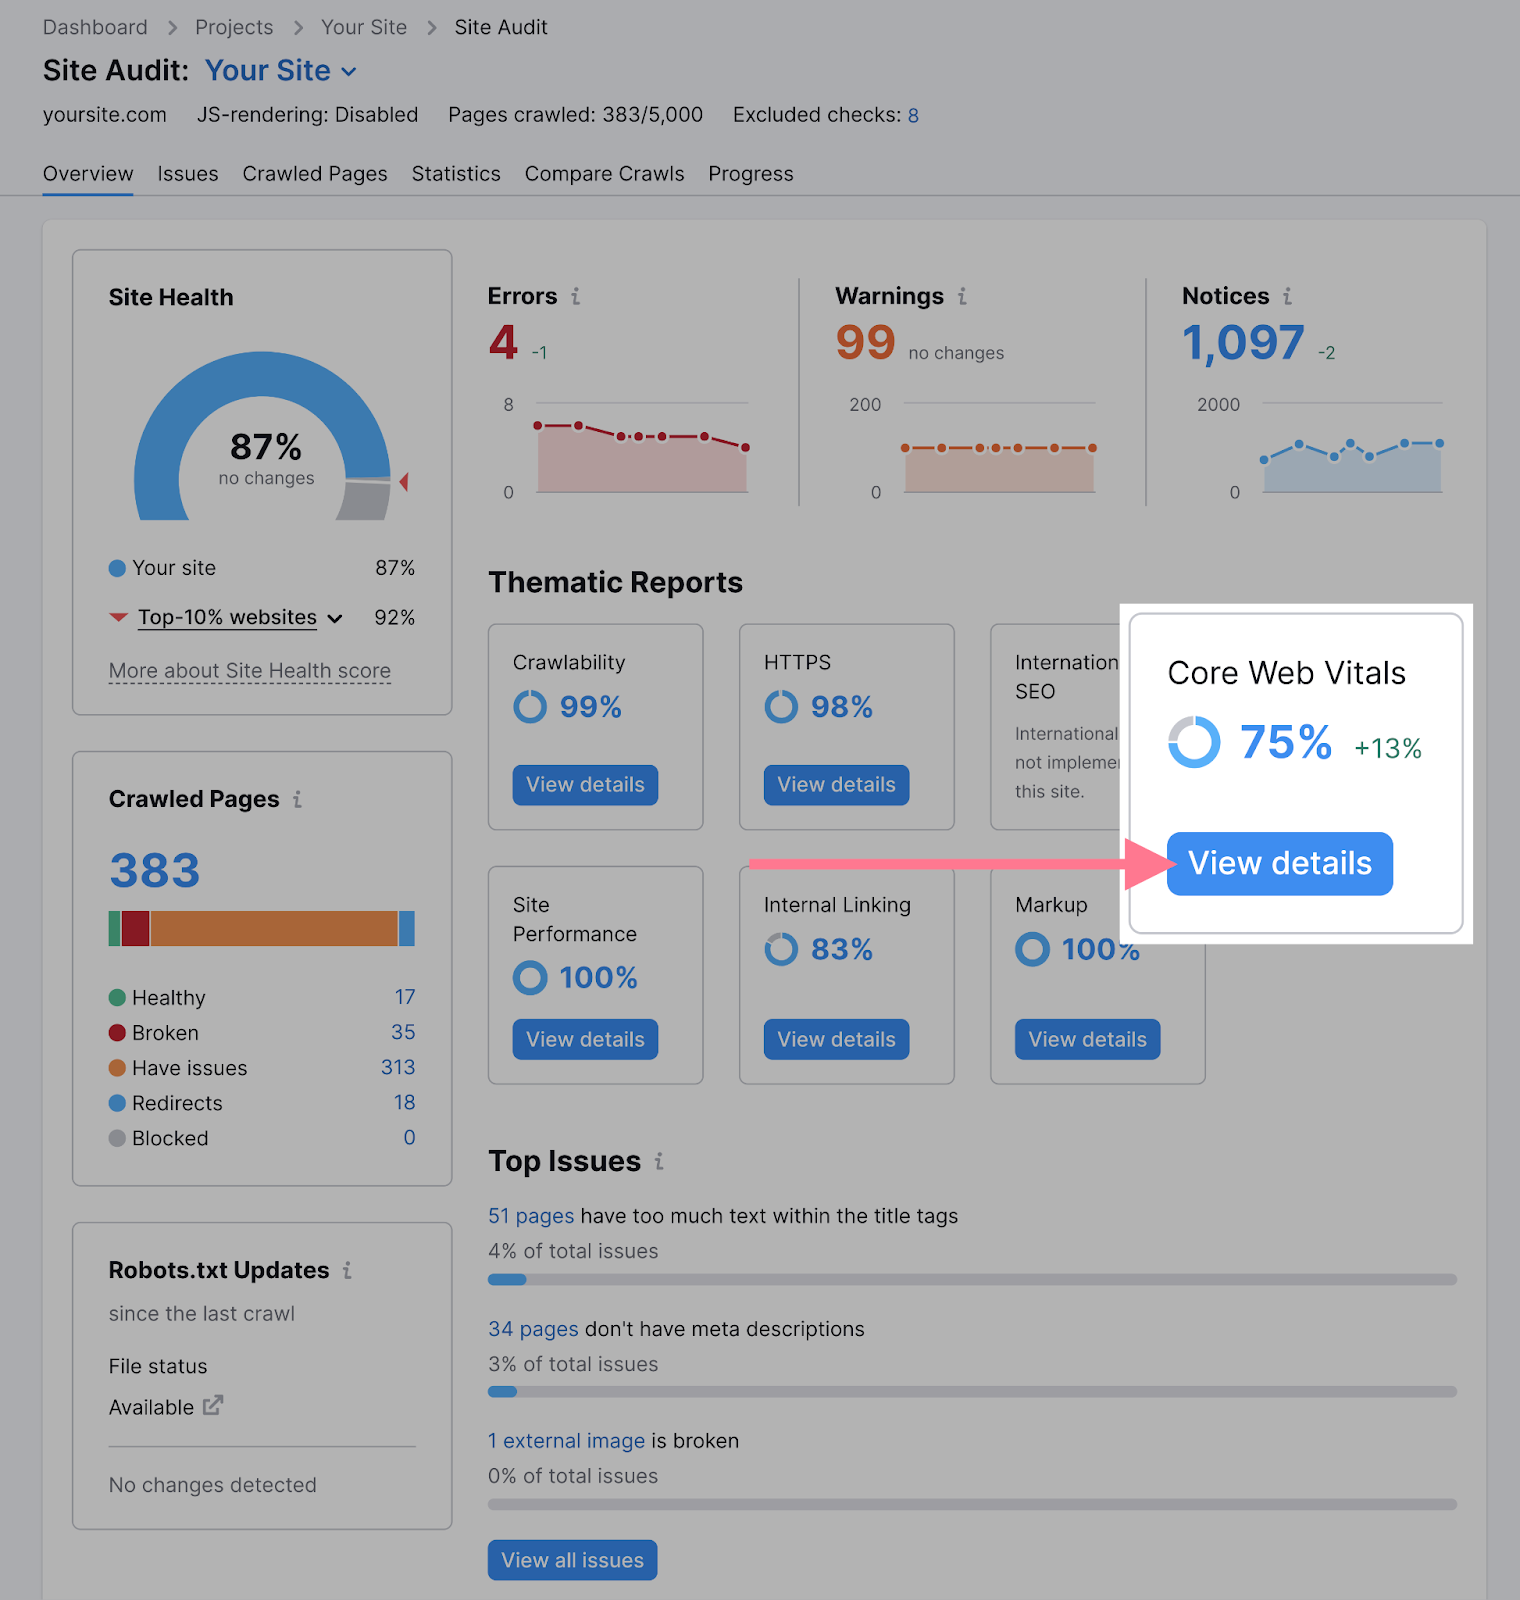
Another useful section is the “Core Web Vitals” report.
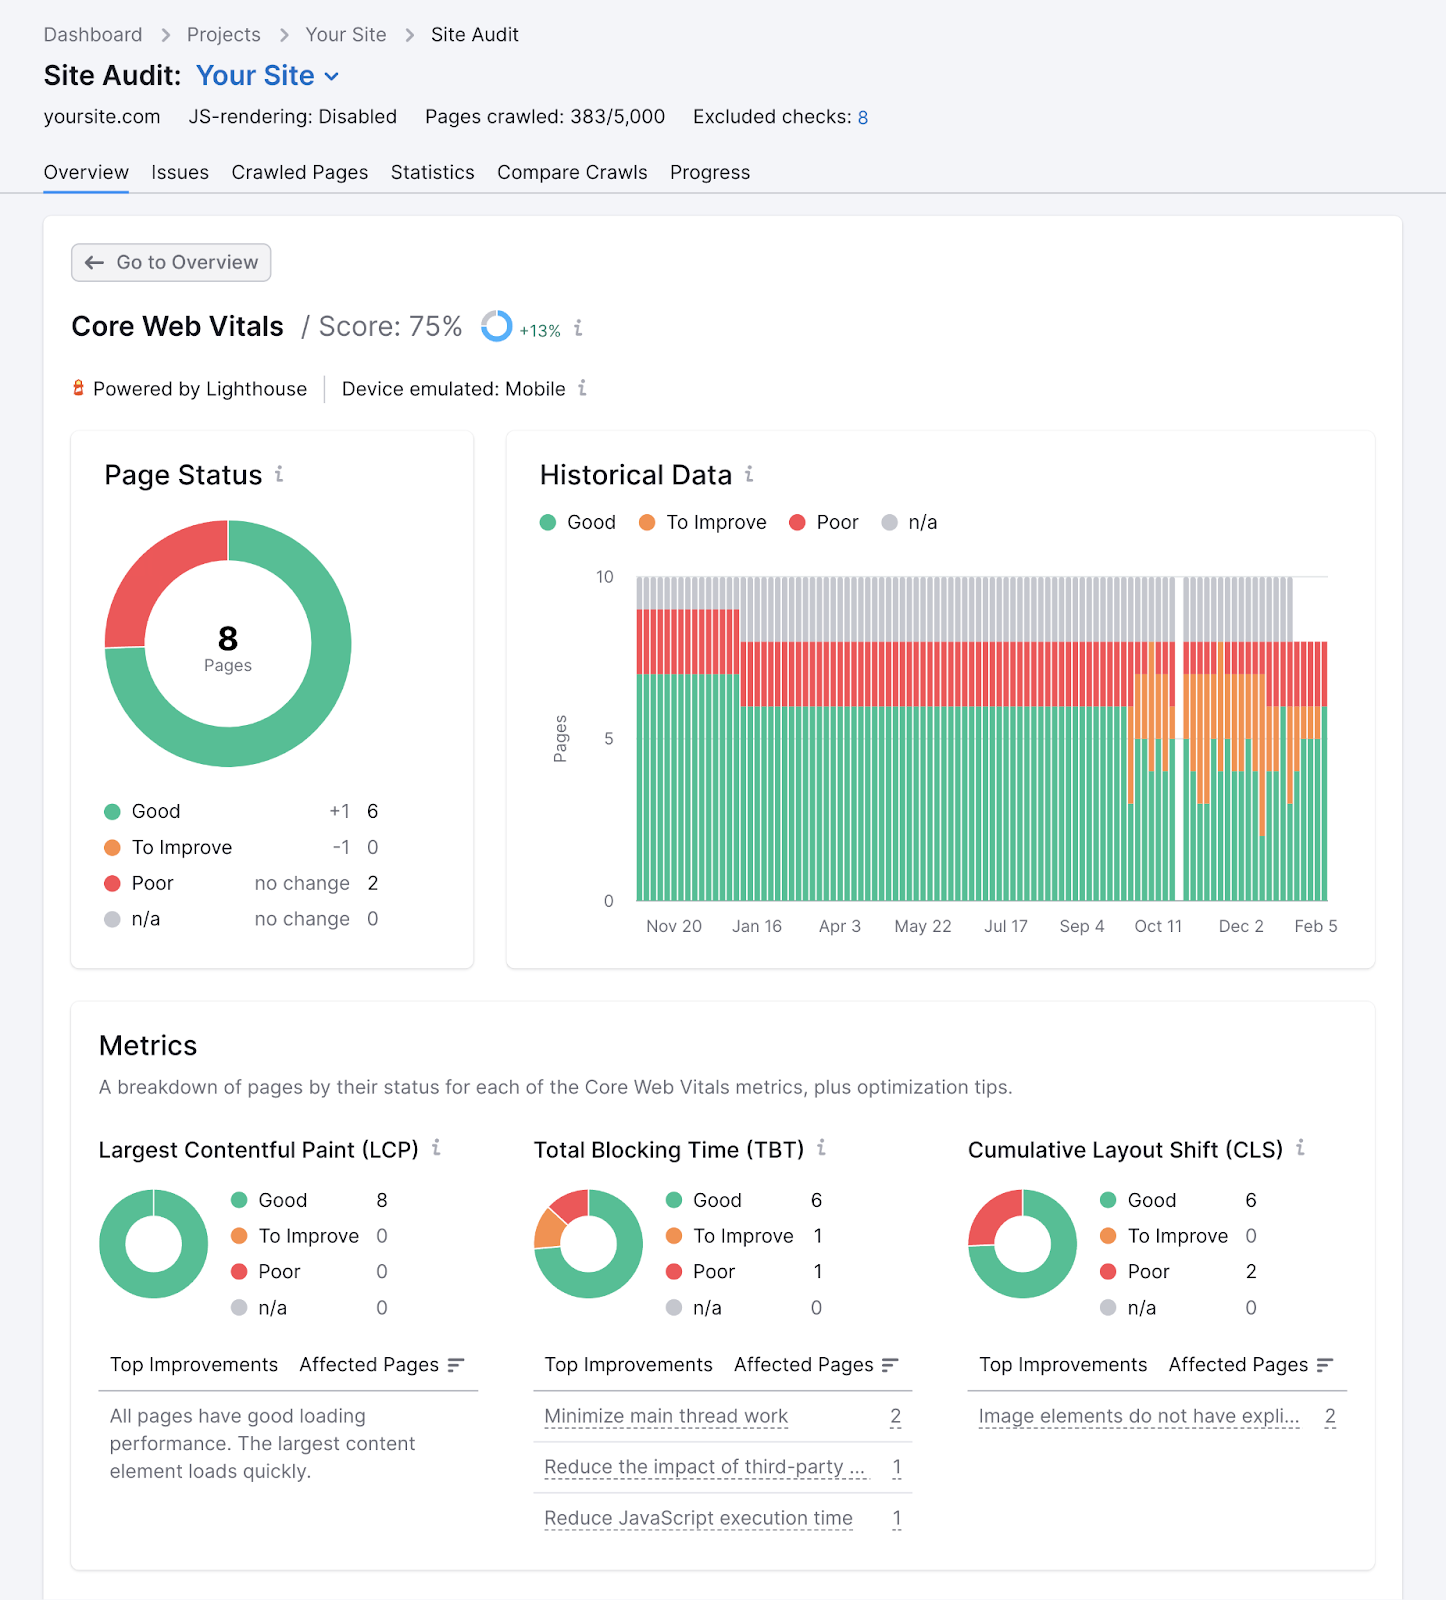
It shows your Core Web Vitals score per page (and recommended improvements):
5 Ways to Improve Your Page Speed
When you analyze your page (or site) with a page speed tool, you’ll get many recommendations to improve its performance.
Some fixes are simple. But if you need guidance on more technical tasks, we recommend consulting a developer.
Let’s analyze the five most common ways to improve page load speed time.
1. Compress Your Images
Images often contribute to slow pages. Compressing your images is one of the quickest solutions to improve your page speed and SEO rankings.
If you can afford to sacrifice a little bit of image quality, you can probably improve your page speed.
Your goal should be to keep images as small as possible without compromising quality or user experience.
Say you want to upload an image that is 1MB and measures 3000 x 2500 pixels.
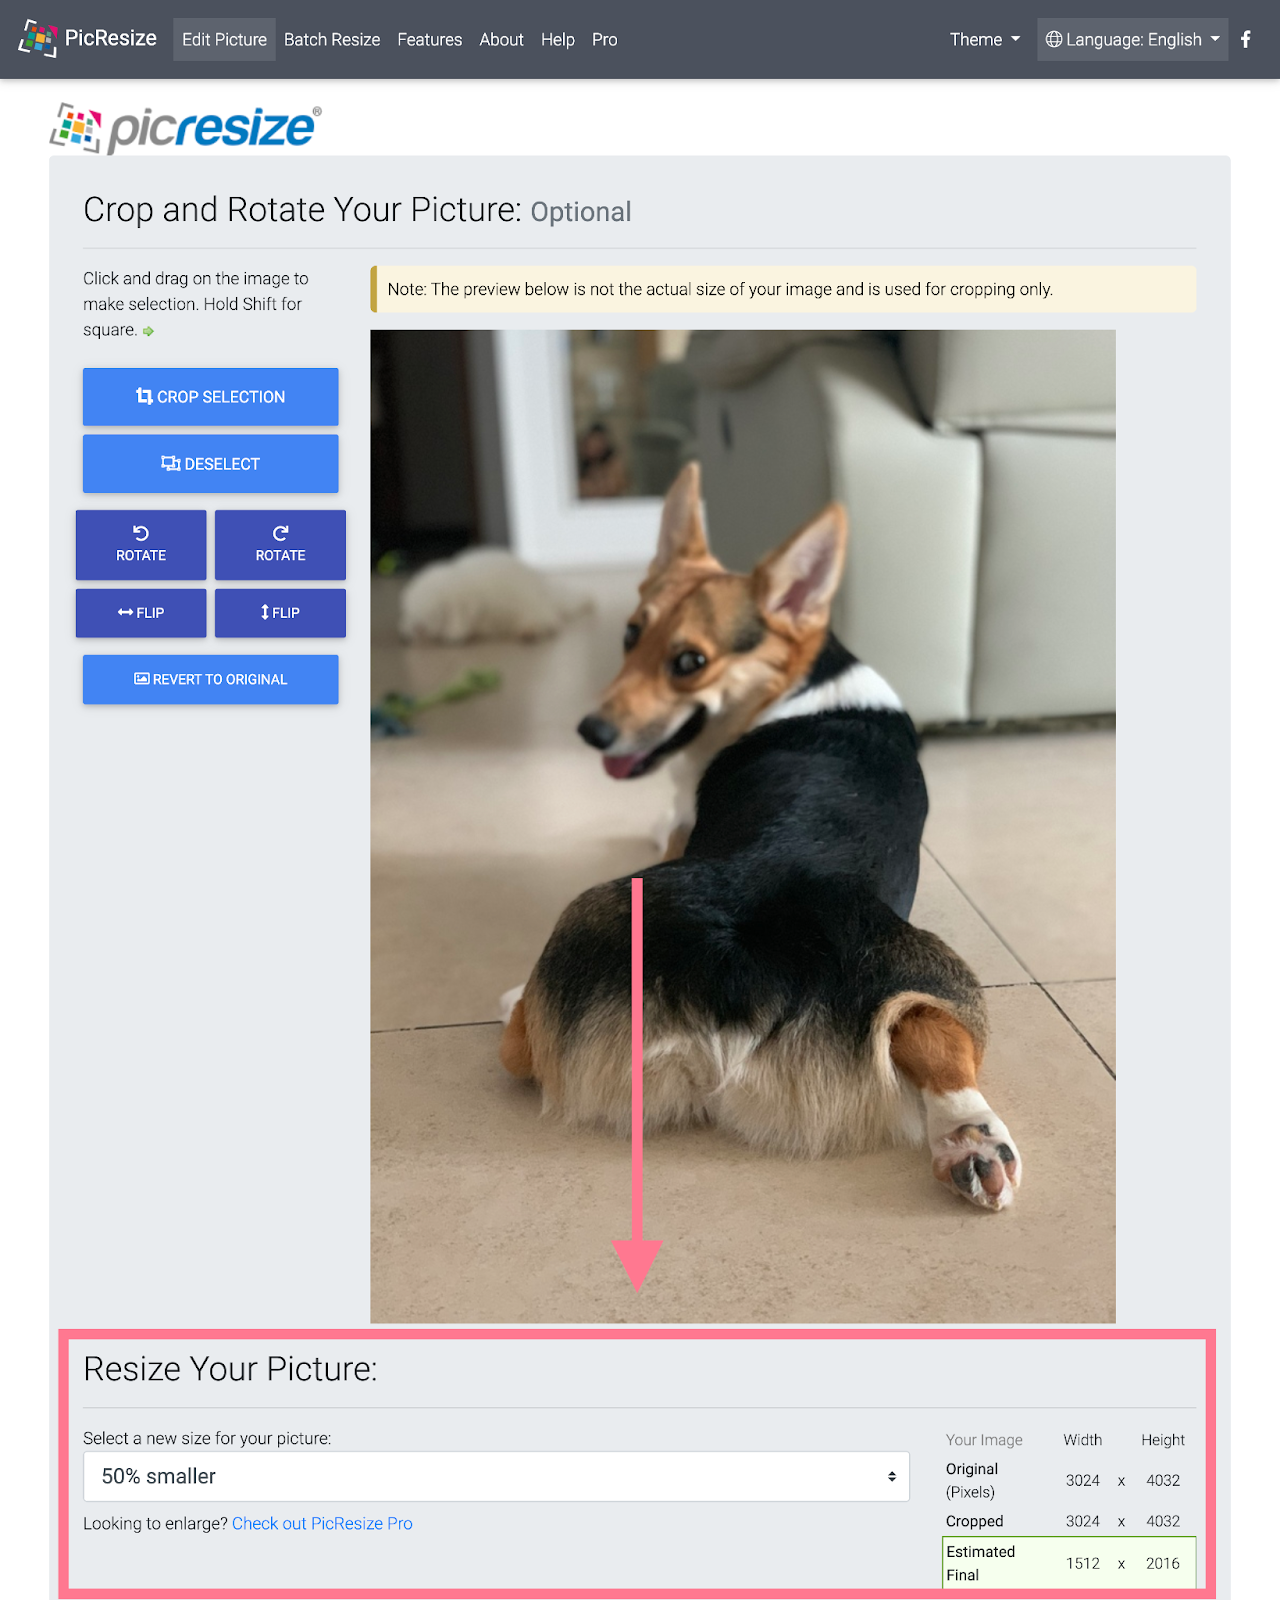
You can resize your image using a free image resizer like PicResize.
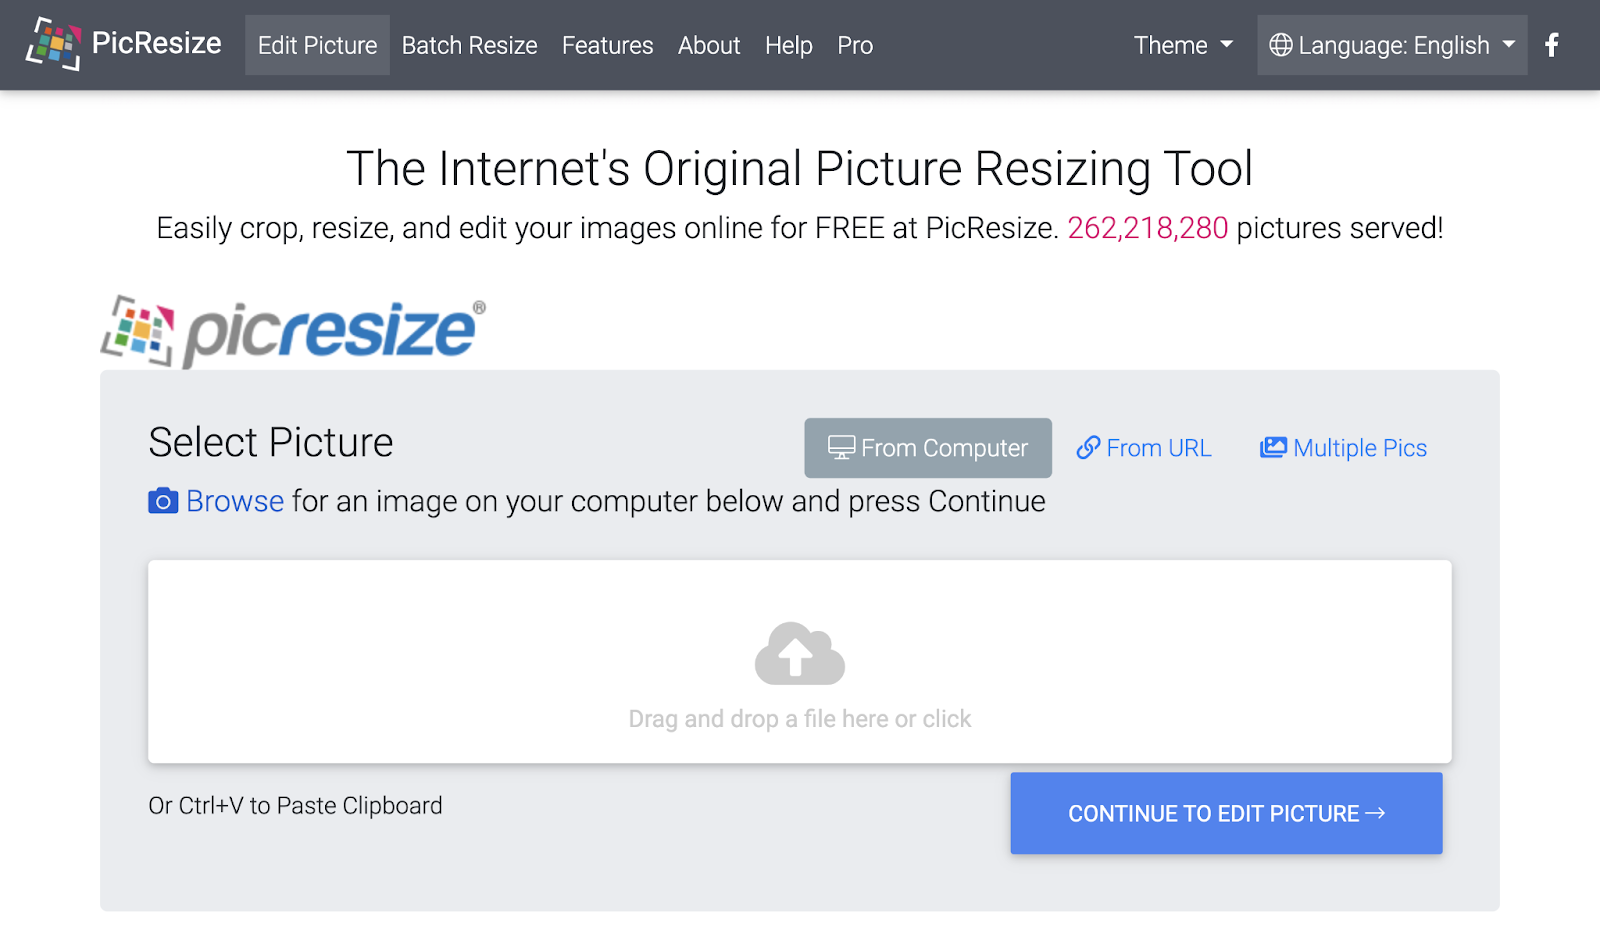
Upload your image to the tool. And select how much smaller you want your image to become (e.g., 50% smaller).
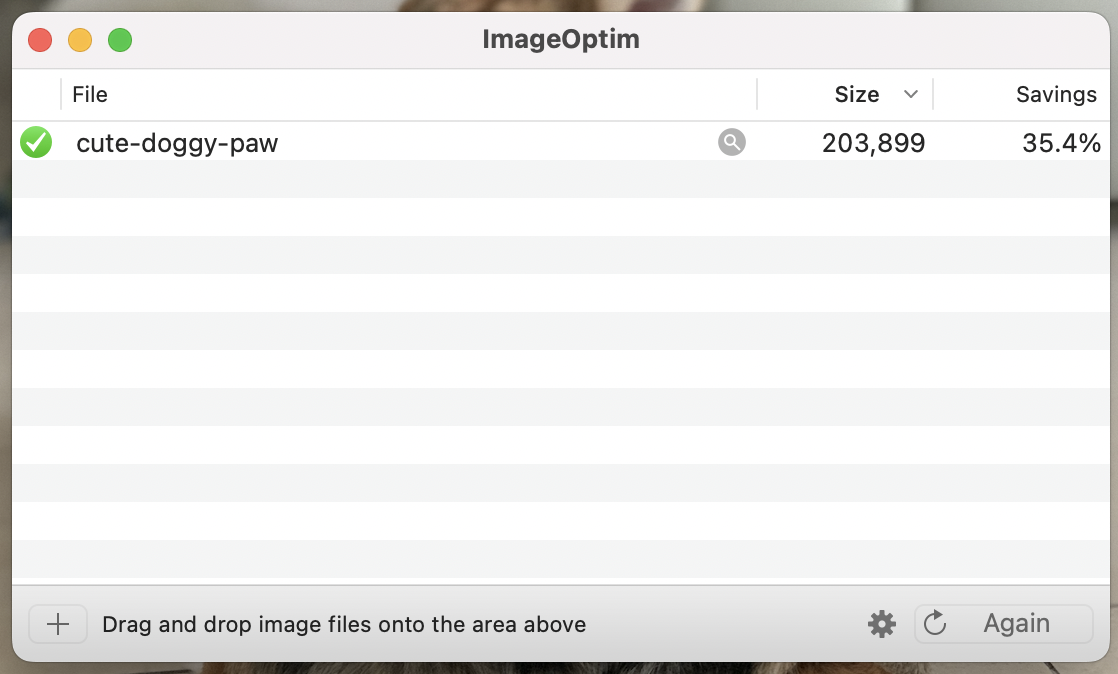
After you make your image as small as possible without compromising quality, use an image optimizer like ImageOptim to shrink it even further.
Simply run your image through the tool, and it’ll do its magic.
Always do this before you upload images to your site.
Pro tip: If you use WordPress as your content management system (CMS), optimize images with a plugin like Smush. It lets you optimize images in bulk to save time.
Choose the Right Image Format
Different types of images require different image file formats.
Some formats are lighter than others because they offer higher compression levels. Choose the right format for each image to lower your page’s load time.
Let’s analyze the most common formats and how to use them:
- JPEG: Good for real-world images, like photographs
- PNG: Good for screenshots, designs, logos, or images with a higher level of detail
- GIFs: If possible, avoid this format, as it will slow down your page. If you need an animated image, consider converting your GIF into a video.
- WebP: This file type is becoming increasingly popular because it’s much lighter than JPEG and PNG (up to three times smaller, in fact.) In the future, it will probably become the standard. However, not every browser supports WebP images yet. So we’d recommend using JPEG and PNG for now.
Pro tip: If you use WordPress, plugins like EWWW Optimizer convert your images into WebP. The plugin will show a JPEG or PNG version of the image if the user opens your site with a browser that doesn’t support WebP files.
2. Reduce HTTP Requests
HTTP requests happen when web browsers send “requests” to a website’s server for more information.
Say a user visits a page. The server gets a request from the browser and answers with a file containing information the user needs to view the page. (This file could contain text, images, multimedia, etc.) The user can’t view what’s in the file until the request is complete.
But if that file doesn’t contain all the information the user needs to view the page, the browser will send another request.
The more requests, the more your page speed slows down. The user will have to wait longer to view the entire page.
Aim to reduce HTTP requests (or to make them load faster) to improve your page speed.
To view a page’s number of HTTP requests, use Google Chrome.
Open your page on Chrome. Right-click anywhere on the page and choose “Inspect.”

You’ll see Google’s developer tools (also called Chrome DevTools). Go to the “Network” tab.
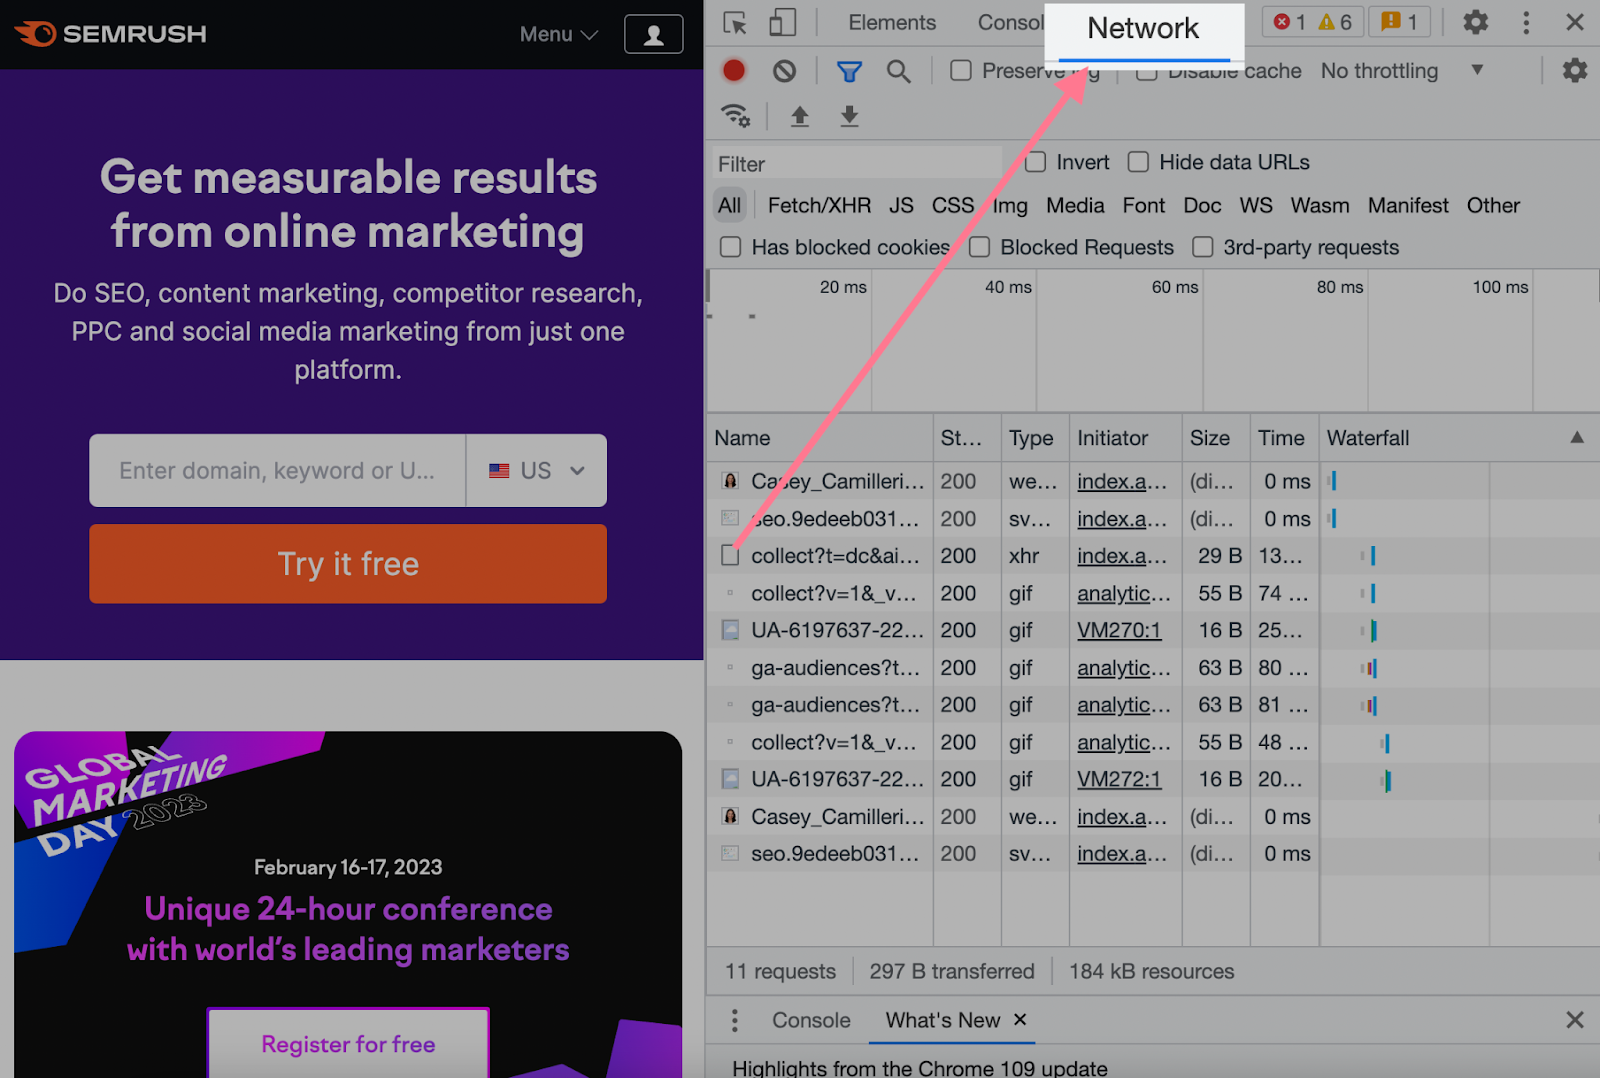
At first, the panel will have few to zero entries. Reload the page to collect data.
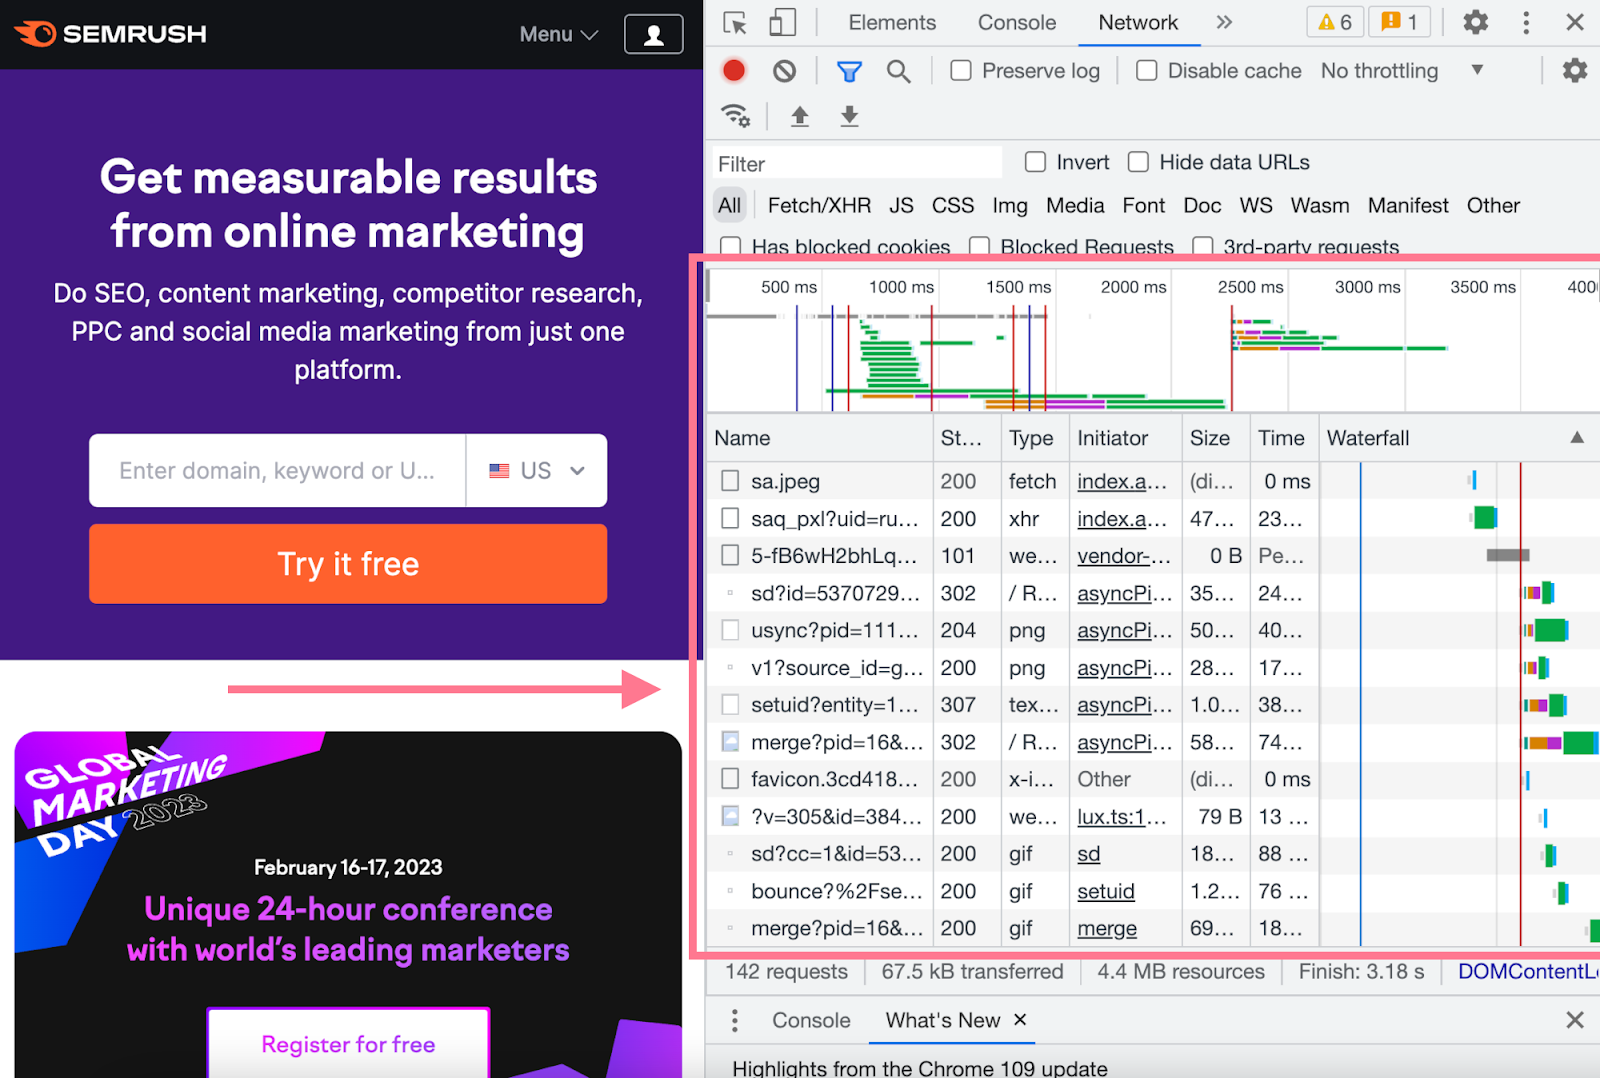
You’ll see all HTTP requests, their sizes, and the time it takes to load them. These include requests for images, plugins, JavaScript or CSS files (more on those later), and many more.
You can also see the total number of requests in the bottom-left corner of the inspect window.
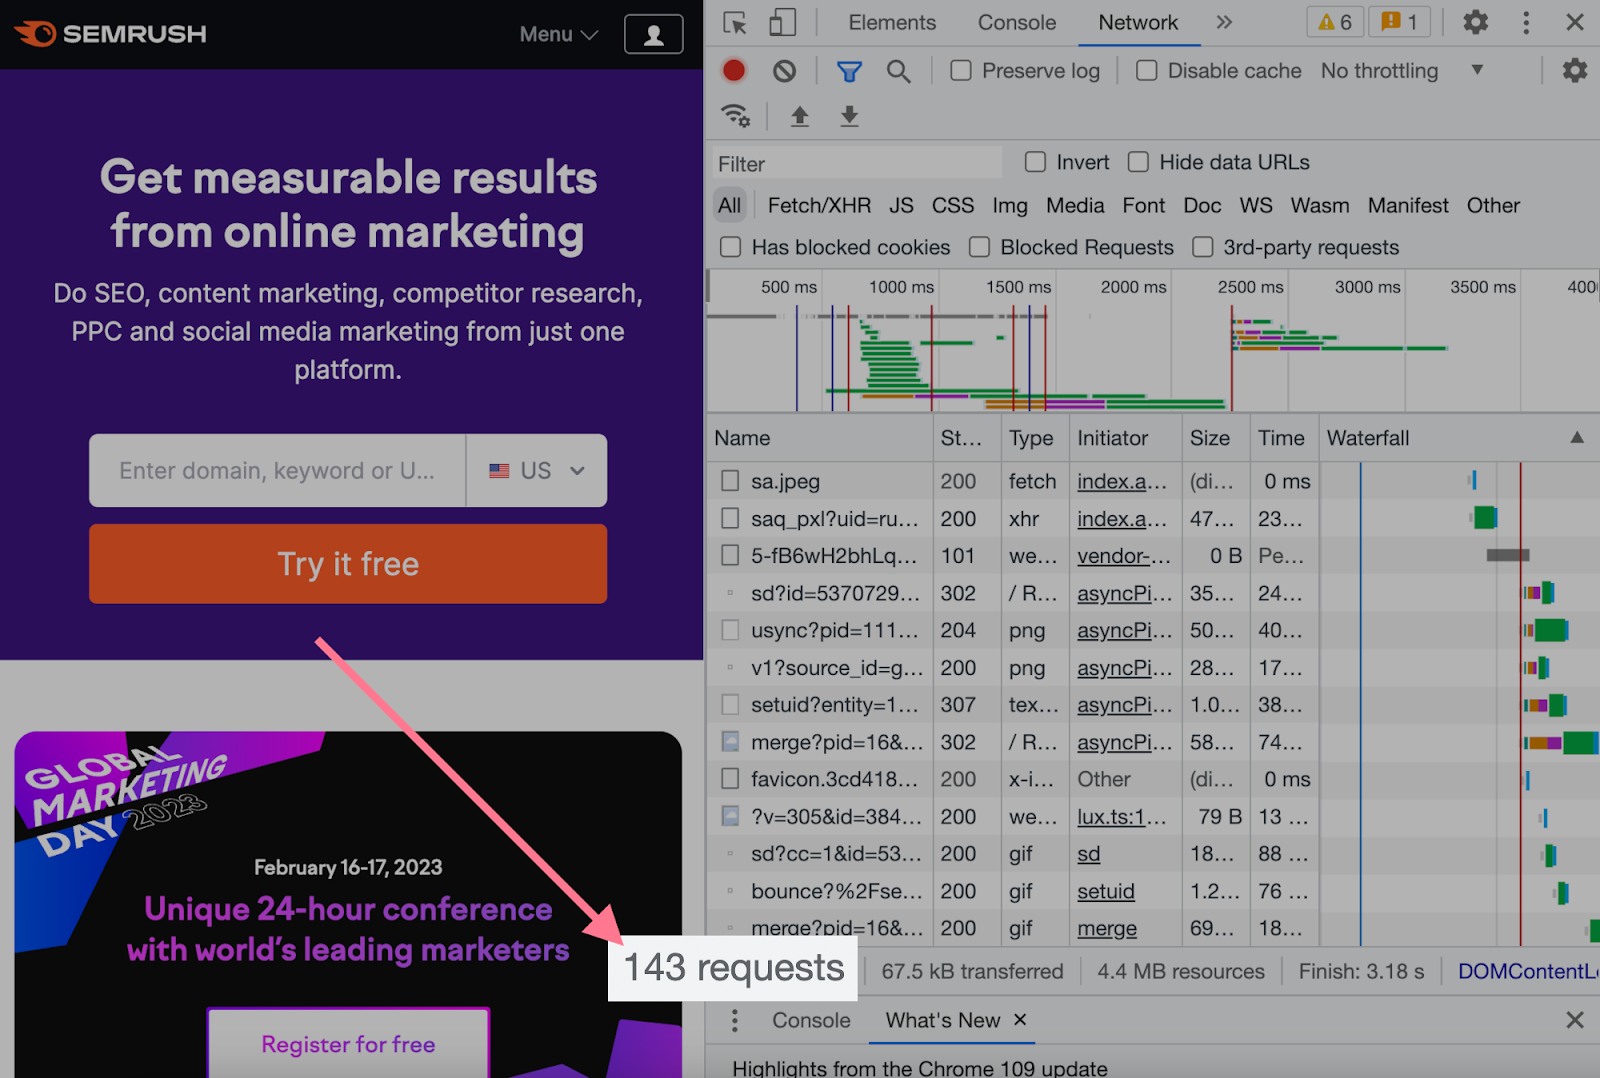
This number is a good way to track your progress. The fewer requests, the better.
For context, the average page sends around 70 HTTP requests. However, there isn’t a specific number to aim for. Use the average number of requests on your webpages as guidance to track your progress.
Tip: Read about Chrome’s Network panel to learn more.
Tools like GTmetrix also count a page’s HTTP requests and group them by type:

Use this tool to get a broad view of your site’s HTTP requests.
Once you identify the requests, you can start fixing them. Unless you are highly knowledgeable in this arena, your safest course of action is likely to consult with an experienced developer to reduce your HTTP requests.
3. Minify JavaScript, CSS, and HTML
Minimizing JavaScript, CSS, and HTML can improve your page speed.
In fact, Google’s John Mueller says minification is “worth looking into” because it can reduce file size.
Start by removing line breaks, white space, or other unnecessary elements in the code that don’t impact user experience.
This is what standard CSS code looks like:
body {
font: 36px Arial, sans-serif;
}
/* Main container */
#container {
color: white;
background: #ffbd17;
width: 630px;
height: 160px;
display: flex;
justify-content: center;
align-items: center;
}
/* Content */
#content {
background: #333;
flex: 0 0 10px;
}
And this is what it looks like after minification:
body{font:36px
Arial,sansserif}#container{color:#fff;background:#ffbd17;width:630px;
height:160px;display:flex;justify-content:center;align-items:center}
#content{background:#333;flex:0 0 10px}
The original version is easier to read for humans. But the minified version is simpler and easier to process for a computer—which is how minification improves page speed.
You can use an online minifier tool to minify your files. And if you own a WordPress website, a plugin like WP Rocket can help you minify your code.
Note: Some tools combine CSS and JavaScript files to improve performance (though it's unnecessary if your site uses HTTP/2 or HTTP/3).
So combining CSS and JavaScript files is only helpful for page speed if your site uses HTTP/1.
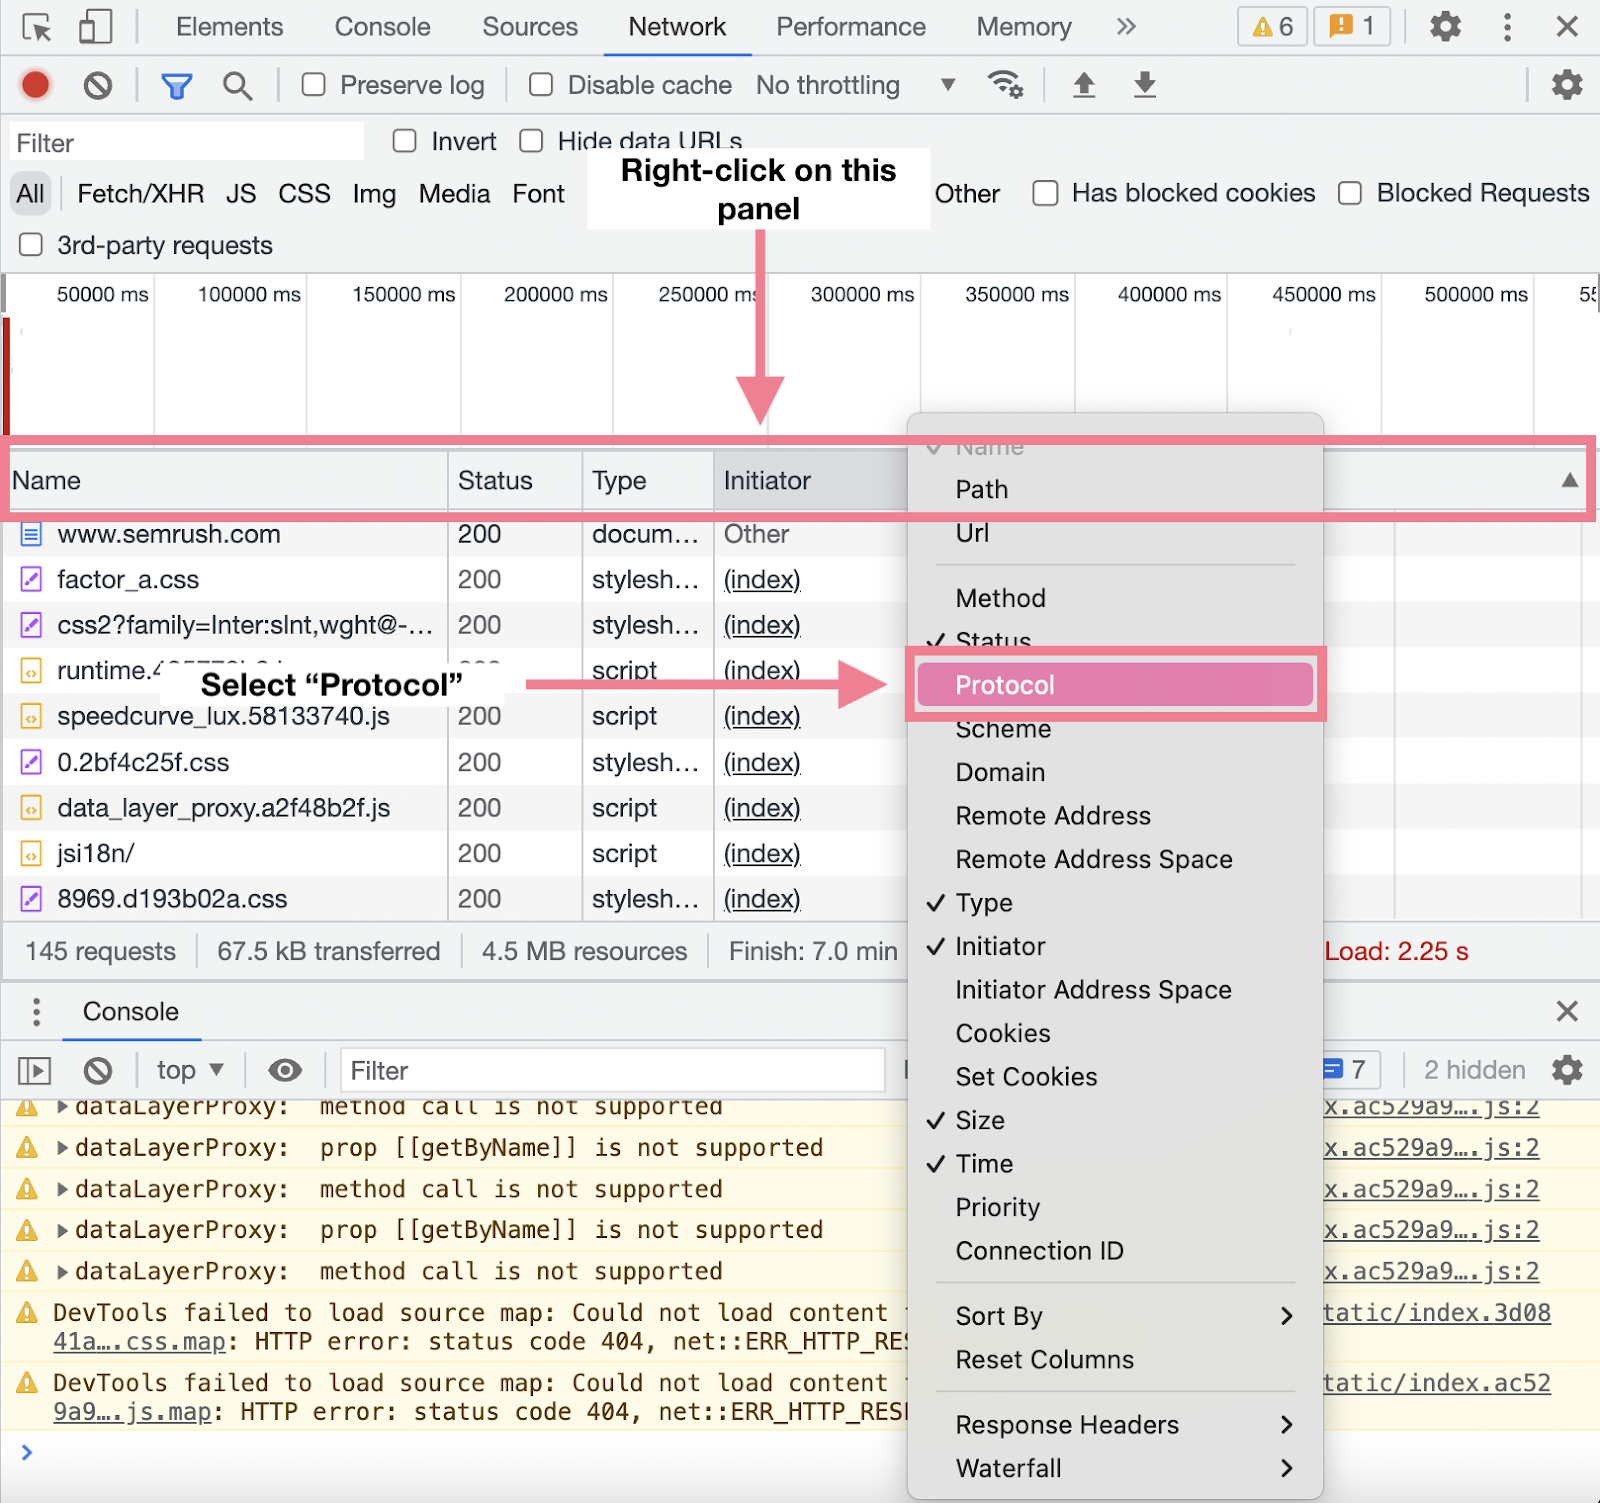
To check which HTTP protocol your site uses, go to Google Chrome, right-click anywhere on the page, and hit “Inspect.” Then, go to the “Network” tab.
Check the “Protocol” column. You’ll see the protocol that each of your internal resources uses.
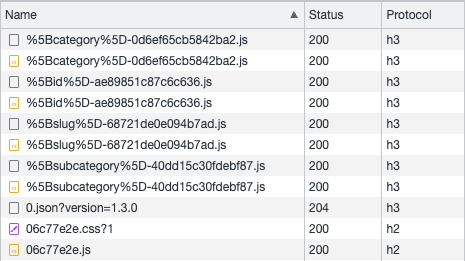
If they’re using “h2” or “h3” protocols (HTTP/2 and HTTP/3), you don’t need to combine your CSS and JavaScript files.
Side note: Can’t see the “Protocol” column? Right-click the chart label panel, and check "Protocol.”
4. Enable Browser Caching
Browser caching is when a user’s browser temporarily stores webpage data. So when the user returns to the page, it loads faster.
Why?
Because the first time a user enters your page, their browser stores many elements (like images or CSS files).
That way, the browser doesn’t need to send as many requests when the user returns.
(This improves the experience of recurring users. But it won’t make a difference for users entering your site for the first time.)
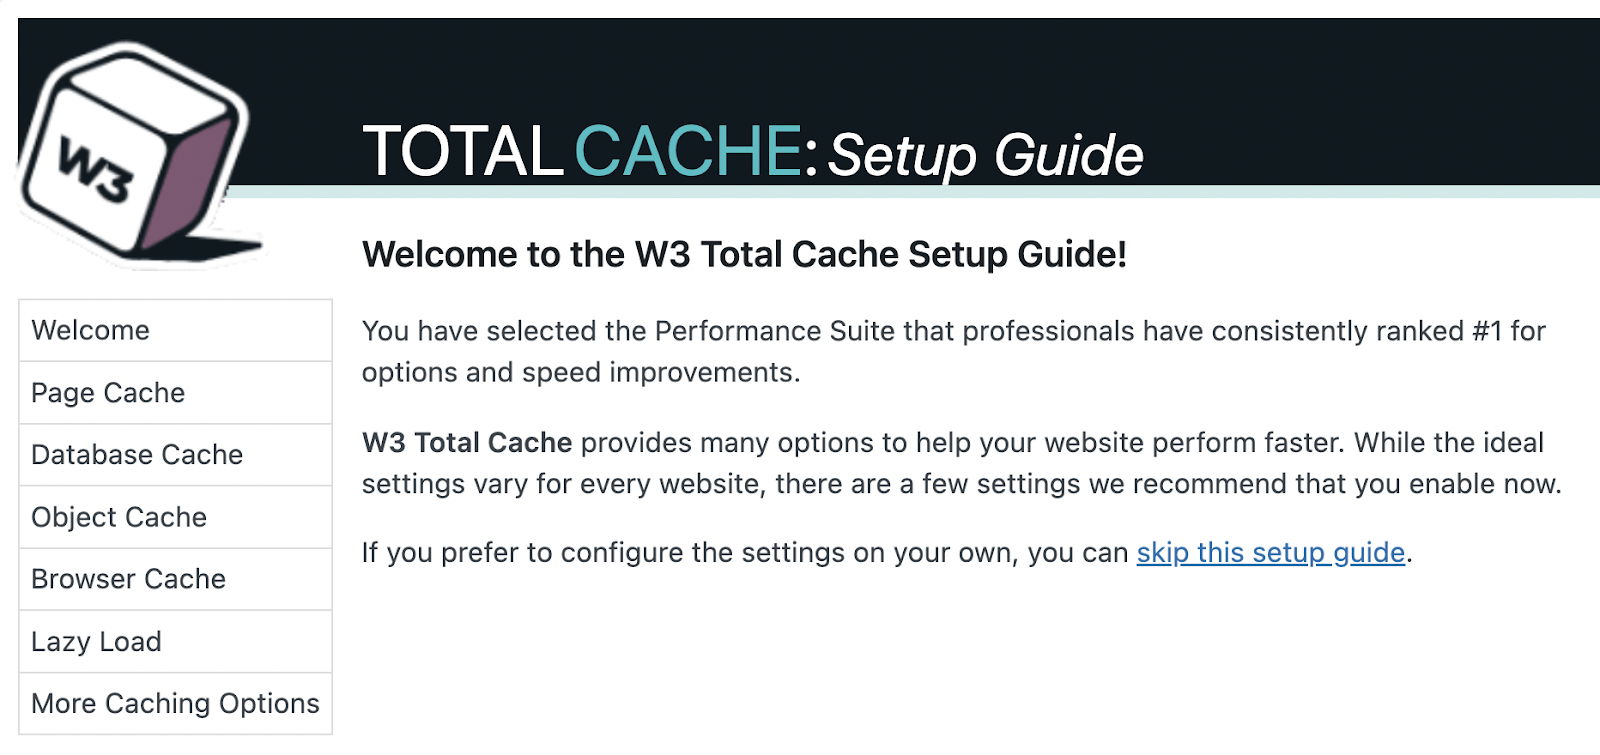
To enable browser caching on a WordPress site, you can use plugins like W3 Total Cache or WP Rocket.
Advanced tip: If you don’t use WordPress, you can add browser caching rules to your .htaccess file. (But you can break your site if you make a mistake, so we recommend consulting a developer).
5. Use a Content Delivery Network (CDN)
A Content Delivery Network (CDN) is a group of interconnected servers distributed across different locations. They bring your site “closer” to each user.
And pages load faster for users that are geographically close to the server where the site is located.
A CDN works like so:
- You cache your site on a CDN
- A user sends a request to open your site
- The server that’s closest to the user delivers the site
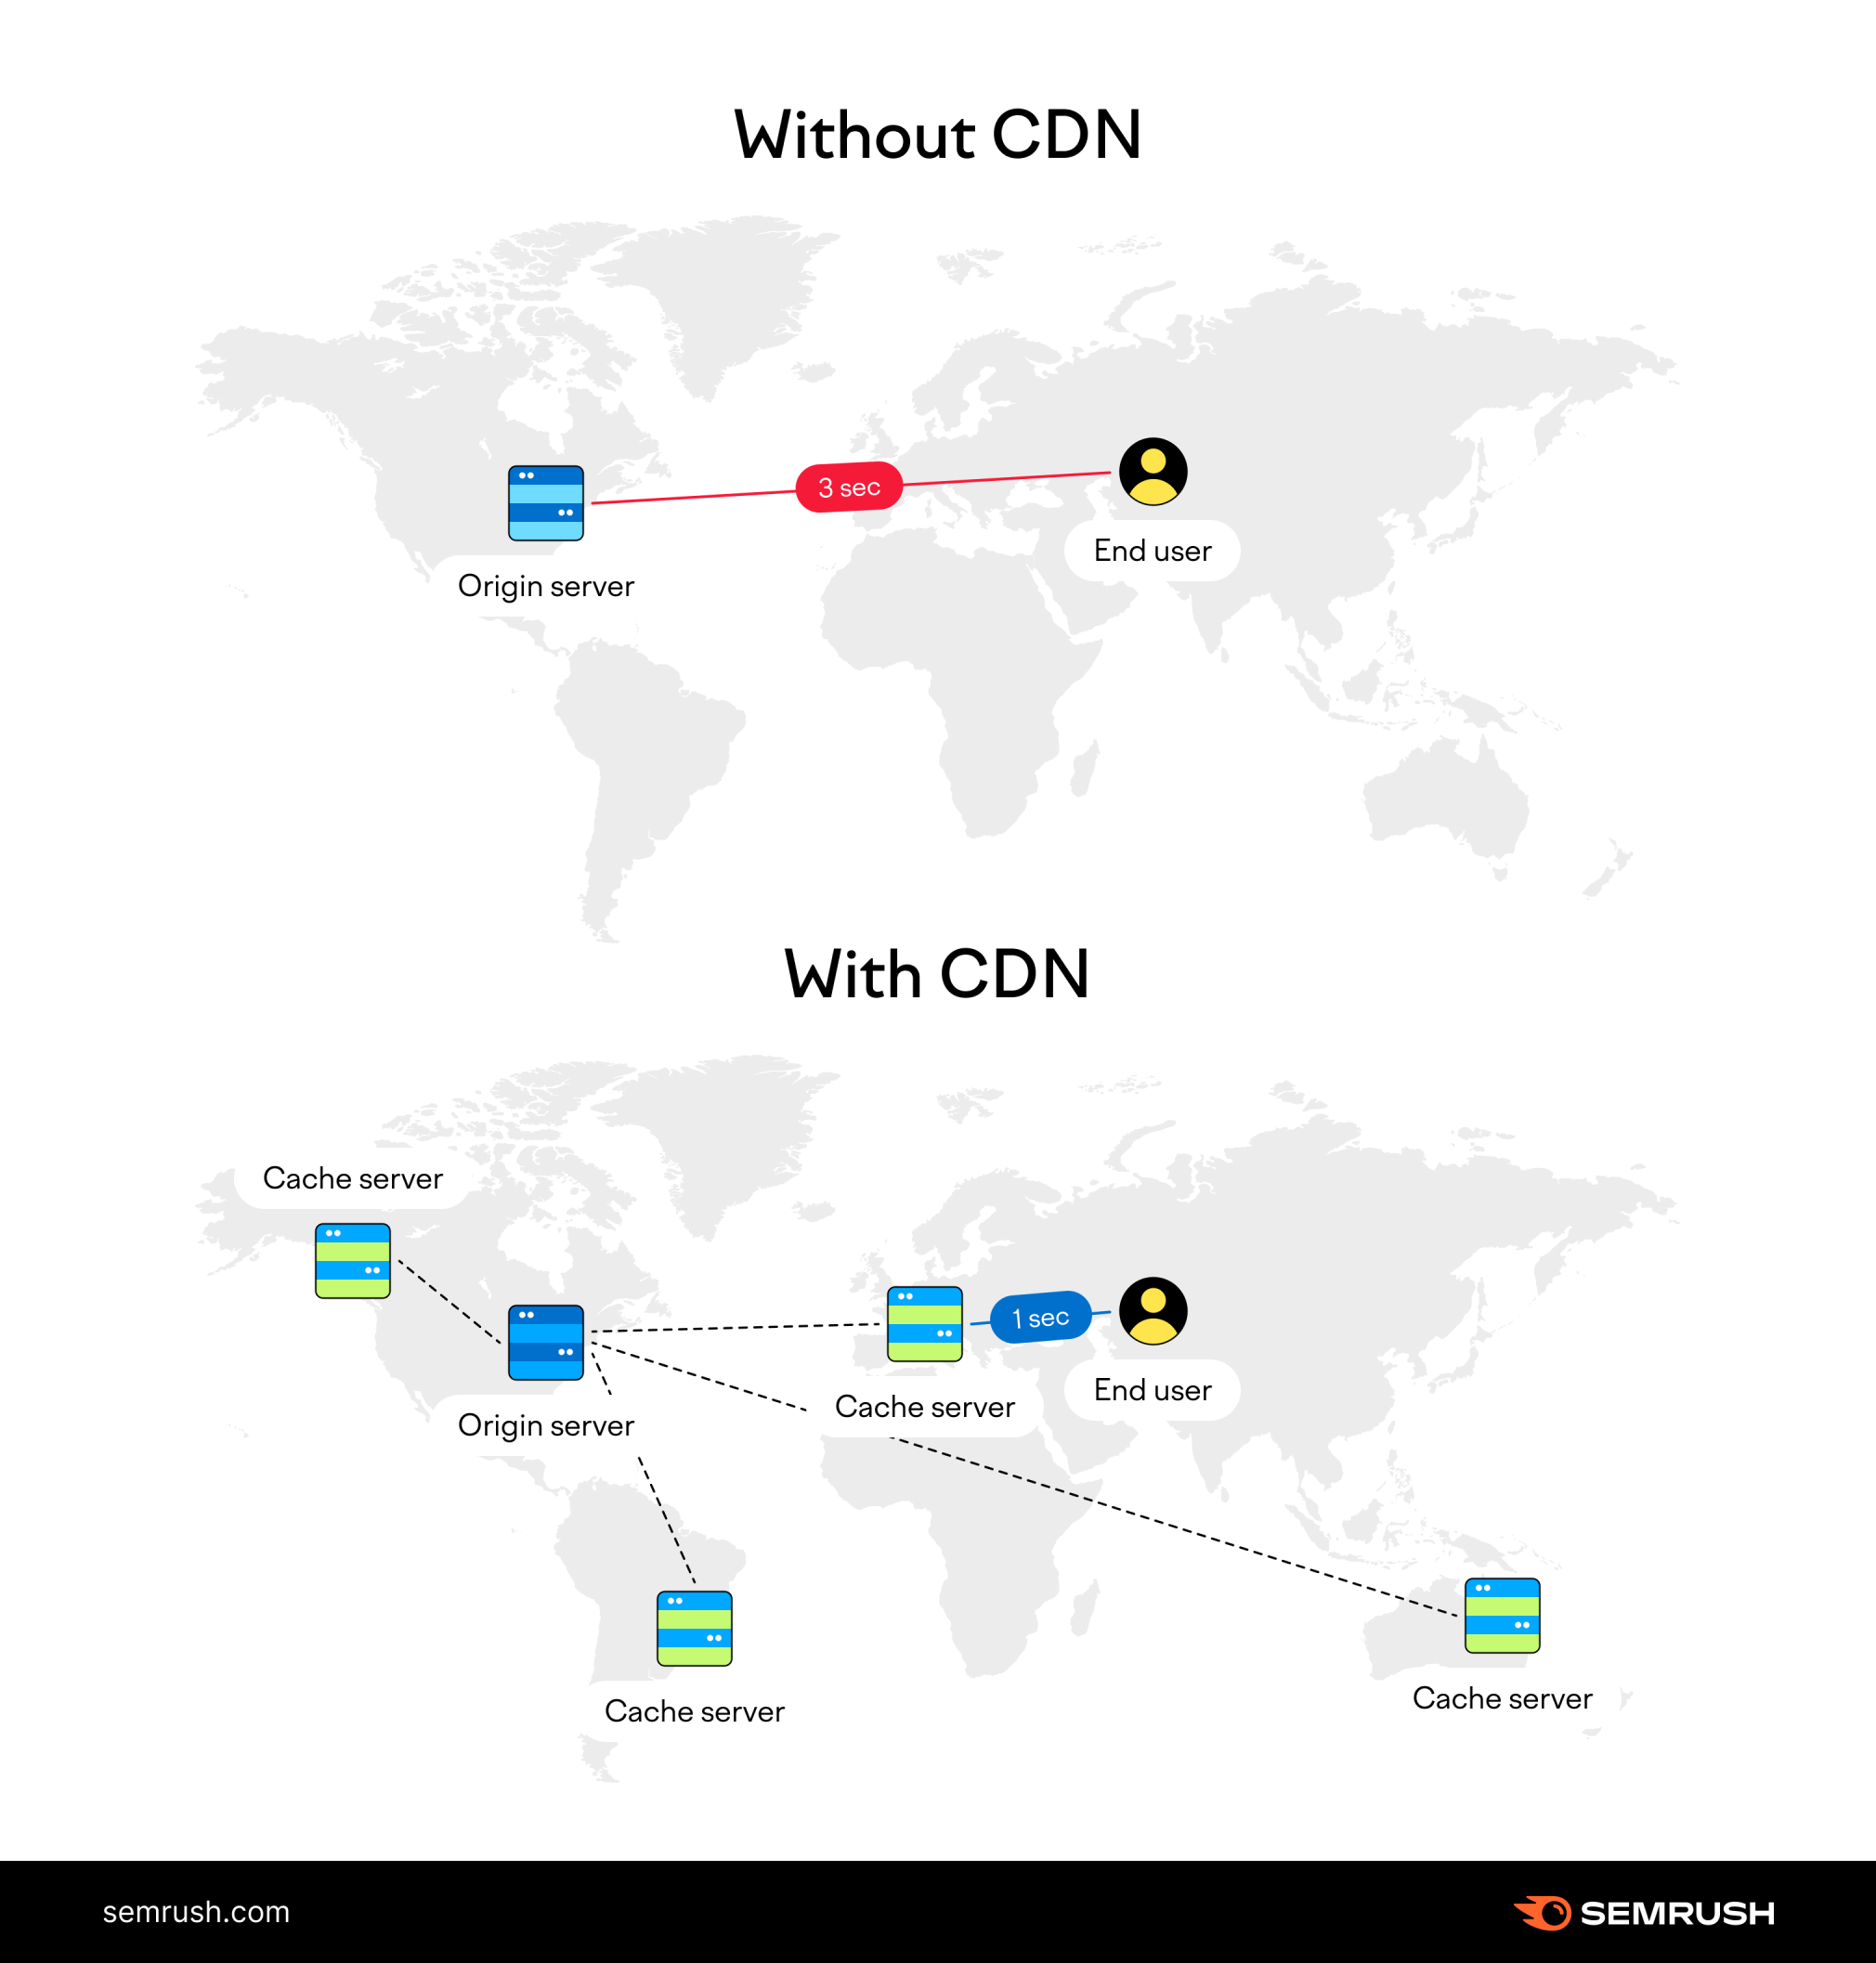
Say your origin server is in Los Angeles.
If a user in Italy tries to access your site, your CDN will find the closest server in the user’s network. (Let’s say it’s in France.) The CDN will then deliver a cached version of your site to the server in France.
Since Italy is much closer to France than to Los Angeles, your website loading speed will improve.
Good examples of CDNs are Cloudflare and Jetpack.
To learn more, read our guide to CDNs and how they work.
Page Speed and Technical SEO
Monitoring your page load speed time is just one of the many steps that can improve your SEO rankings.
To learn more about technical SEO, check these resources:
- What Is Technical SEO? Basics and 10 Best Practices
- On-Page and Technical SEO Course [Free video course on Semrush Academy]
- How to Perform a Complete SEO Audit (in 15 Steps)
